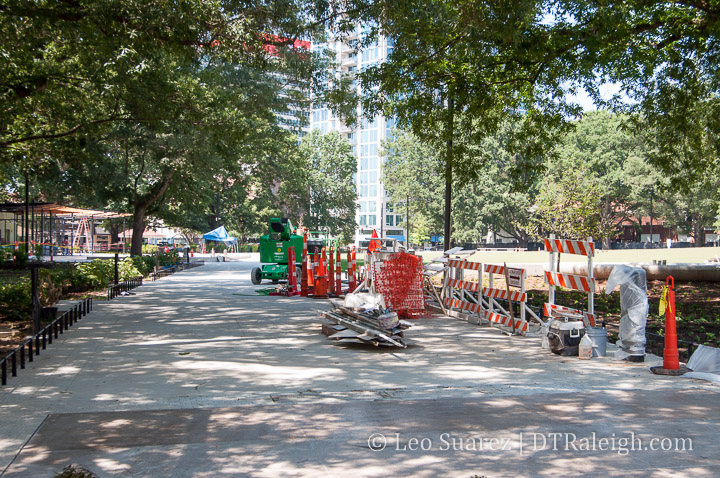
Final touches being applied to Moore Square. July 2019.
Moore Square is getting close to wrapping up its makeover as the city has announced a string of events to celebrate the reopening of the downtown square. The grand opening party is on August 3rd but there will be events the night before as part of First Friday.
Moore Square Grand Opening Celebration
Date/Time: Sat., Aug. 3 from 11 a.m. to 4 p.m.
Moore Square Park
226 East Martin Street
The full schedule is here. With live music, a playground for kids, and a movie, the events should test out the square’s ability to play host.
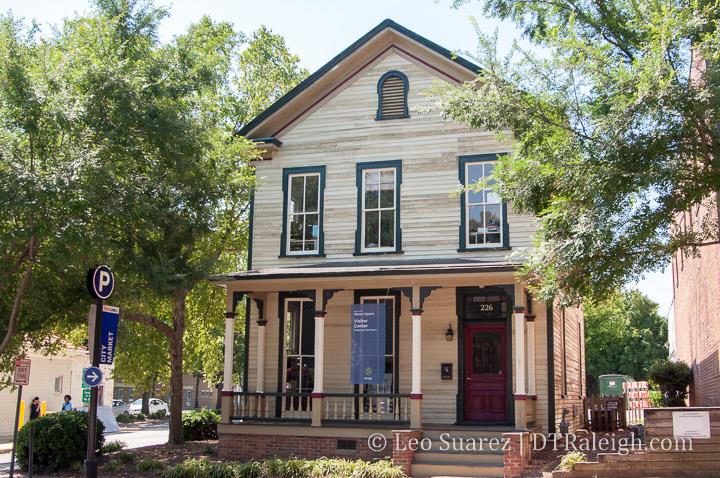
In addition to the square, the house at 226 East Martin will be the Moore Square Visitor’s center. The center will sell local merch in addition to “a history exhibit detailing the historic significance of the Square and surrounding district to the city of Raleigh.”
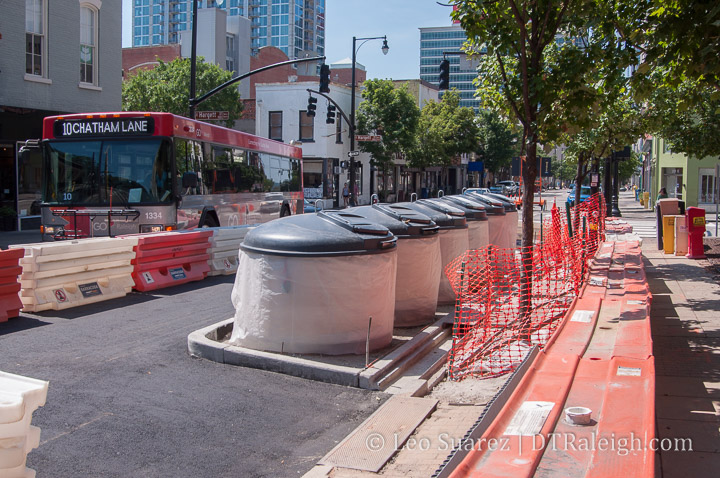
First to be used in the country (yes, that’s right) the new Molok trash containers are being installed at the corner of Wilmington and Hargett Streets.
Each partially-underground container holds the equivalent of 20 trash bins of waste. This reduces the need to make as frequent pickups, currently at twice a day, and could potentially remove the trash bins that clutter the sidewalks near this intersection.
Nearby restaurants, and pedestrians, can just dump their trash directly instead of using the roll-out carts. Emptying a trash bin only takes minutes so in under 20 minutes, the six containers should be emptied.
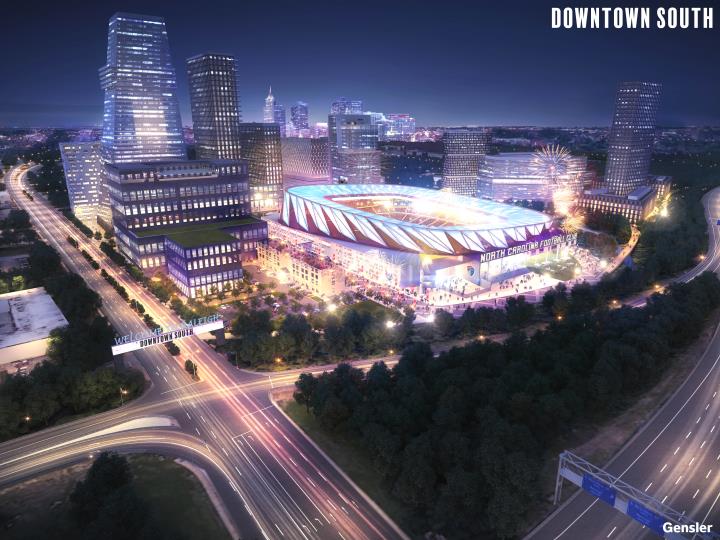
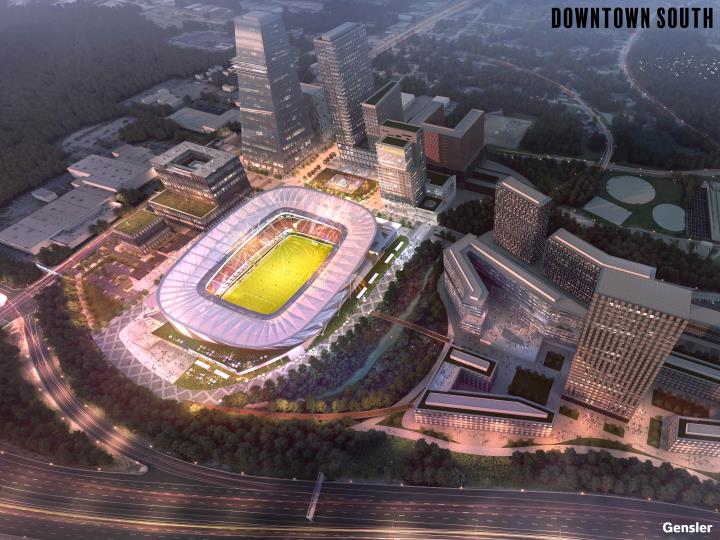
A little outside our typical watch area, last week, Steve Malik, the owner of the North Carolina Football Club, and John Kane, a Raleigh developer, announced a $2 billion vision for the area near South Saunders and I-40. Downtown South would be a mix of office, residential, and hotels around a 20,000 seat soccer stadium.
All the details are over at visitdowntownsouth.com.
Recall that a downtown soccer stadium was proposed in July 2017 as Major League Soccer was touring cities as possible expansion teams for the league. This time around, Malik says that a pro team is not needed for the area’s success.
The stadium could be used for NC Courage and NCFC games as well as events. The area would be supported by mixed-use development including:
125,000 square feet of retail/restaurant space
1.6 million square feet of office space
1,200 hotel rooms
1,750 residential units
A huge kicker to all this is the need for public funding. The group will be pursuing $13 million a year for 20-25 years which is typically funded from the Wake County room occupancy and prepared food and beverage taxes.
Assuming the county backs the request for funds, the group claims construction could start in 2020 with the stadium and first phase completed in 2023.
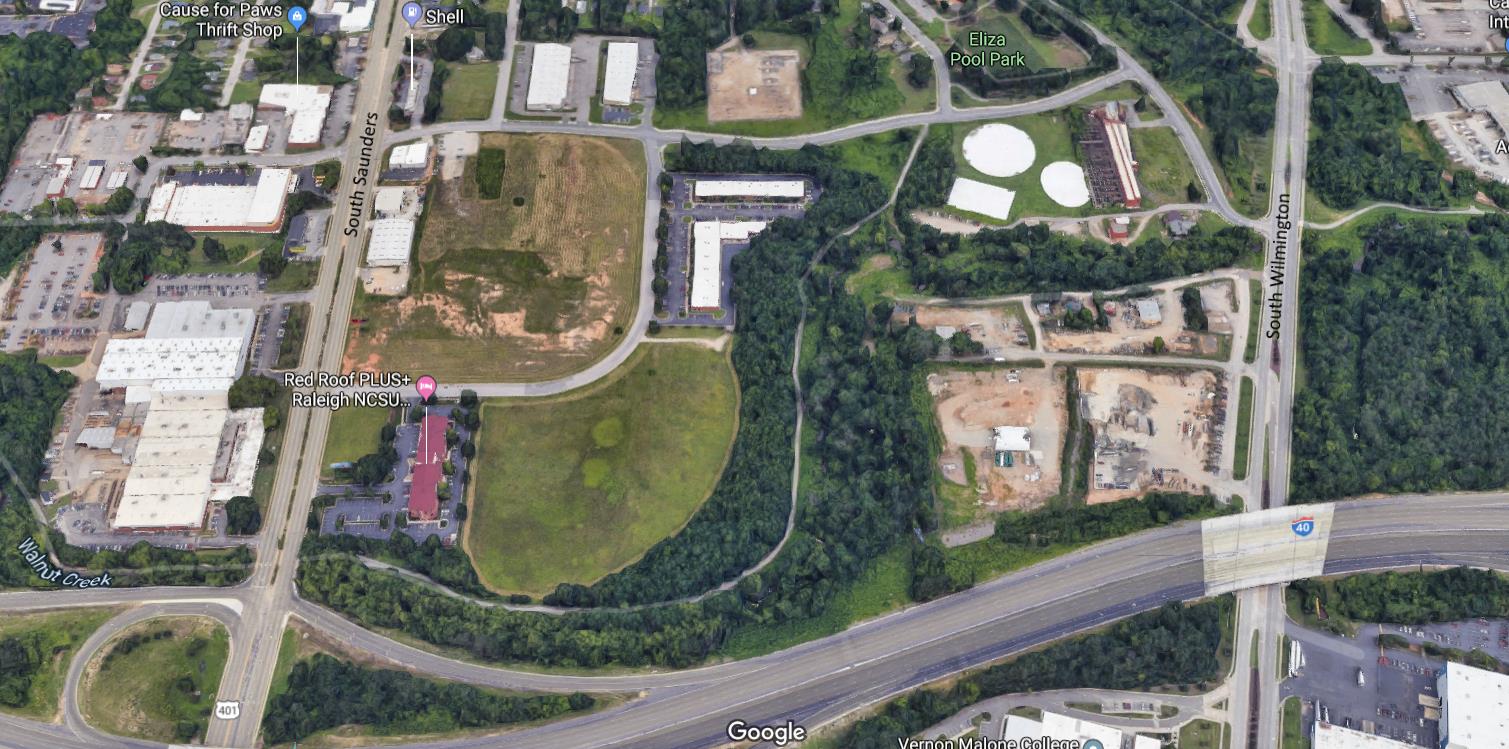
The current site is actually a bit empty with a few businesses and one-story buildings. The group has rights to develop land between Saunders and Wilmington. Note, this does not include the Bain Water Plant located along Water Works Street.
Current aerial of Downtown South site. Click for larger.
While not downtown proper, a large project like this has the potential to stretch the urban grid south towards the highway. It’s only 1.5 miles from the proposed soccer stadium to the Raleigh Convention Center or the big field in Dix Park.
The future Bus Rapid Transit (BRT) line is planned to use either Saunders or Wilmington which would be a great service for events as well as commuters to the new office space. It would be great to get out in front of the development and encourage transit-friendly integration and lower parking requirements.
The street grid between Downtown South and the core business district isn’t as urban as it should be and historically has been widened for faster car travel. If Downtown South is built out to it’s fullest, future planning may couple the two areas closer together setting off more urban development in-between.
This one will be fun to watch so make sure to let your representatives know what you think as the developers claim this vision won’t happen without those public funds.
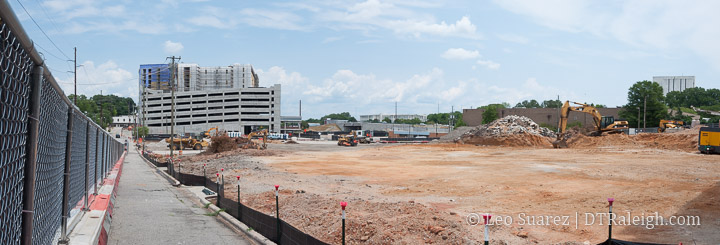
Phase 2 of the Smokey Hollow project in Glenwood South is all clear for construction. The site has been flattened out and all that surface parking and single-story buildings have been removed.
To review, this May 2019 post has a nice aerial to show each lot for each phase. To start at the beginning of phase 2, you can review this October 2018 post that has all the pretty renderings.
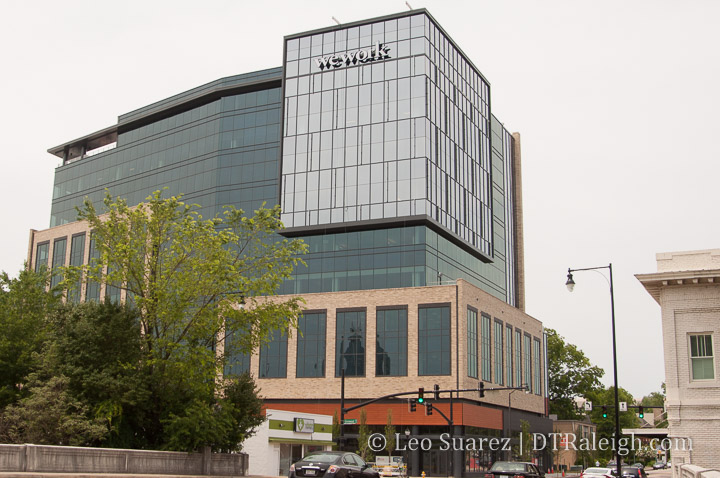
There’s a new sign in the Raleigh Skyline. One Glenwood now has the WeWork signage up on the building and after being open for a just a few months, the building is almost completely leased up.
This bodes well for the sister building that’s planned to be built right behind it as part of the Bloc 83 project.
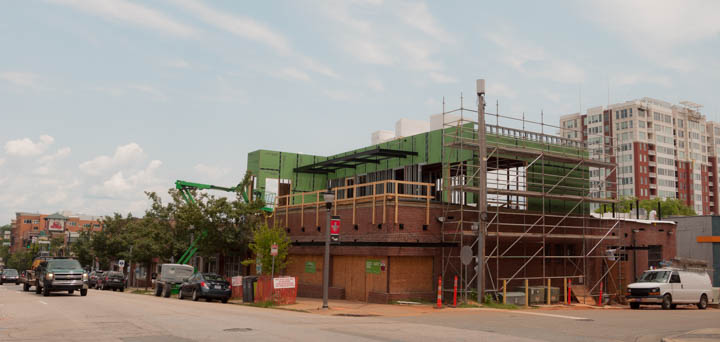
Glenwood South is getting a Tin Roof bar at the corner of Glenwood and Lane. The live music bar has over 15 locations in the US and you can see the second floor and outdoor space coming together in the photo above.
Having never been but eager to check it out, I see the place also serves food as well. The bar plans to open “late summer” which is great timing for the nice fall weather.
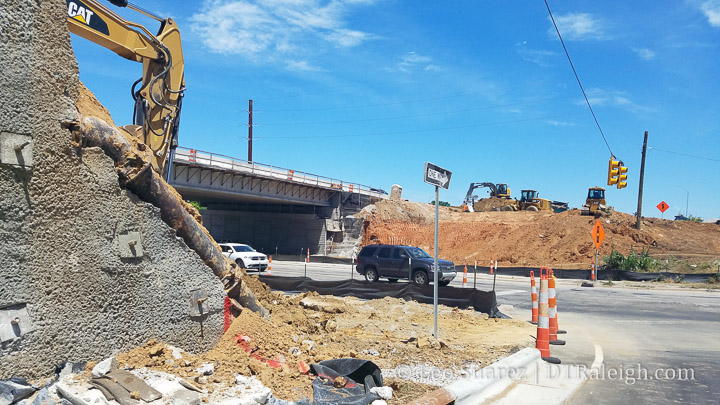
The old Capital Boulevard bridge over Peace Street has now been removed.
Torn apart and dismantled during the night throughout the last few weeks, the bridge that was close to reaching its end-of-life and has stood up over Peace for over 50 years is no more.
The “square-loop” traffic pattern is more and more coming into place around the new bridge, which already has traffic flowing in both directions. With the northbound exit to Peace now open, the next major connection should be the new Peace to Capital on-ramp (and Cotton Mill entrance) road.
I’m really hoping to see this project wrap up this year as was planned.
It’s been a year since I announced the launch of the DTRaleigh Community and soon after shut down traditional comments on this blog. After 365 days, I couldn’t be happier with the results.
In the past year, downtown enthusiasts have been chatting more and even meeting face-to-face. There’s even more eyes on downtown development as residents report in and others ask questions. Answers are found through crowd-sourcing and the conversation is in-depth and respectful.
There are almost 300 registered users and easily hundreds more who read the public-facing topics. Registrations slowly tick up every few days.
As the sole moderator, I’ve found it easy and after users have gotten used to the software, it’s mostly self-policing with rants and flamewars kept to an almost negligible amount.
If you haven’t signed up, I encourage you to do that and jump in with whatever downtown Raleigh topic that’s on your mind. There’s room to grow and who knows where it will go from here.