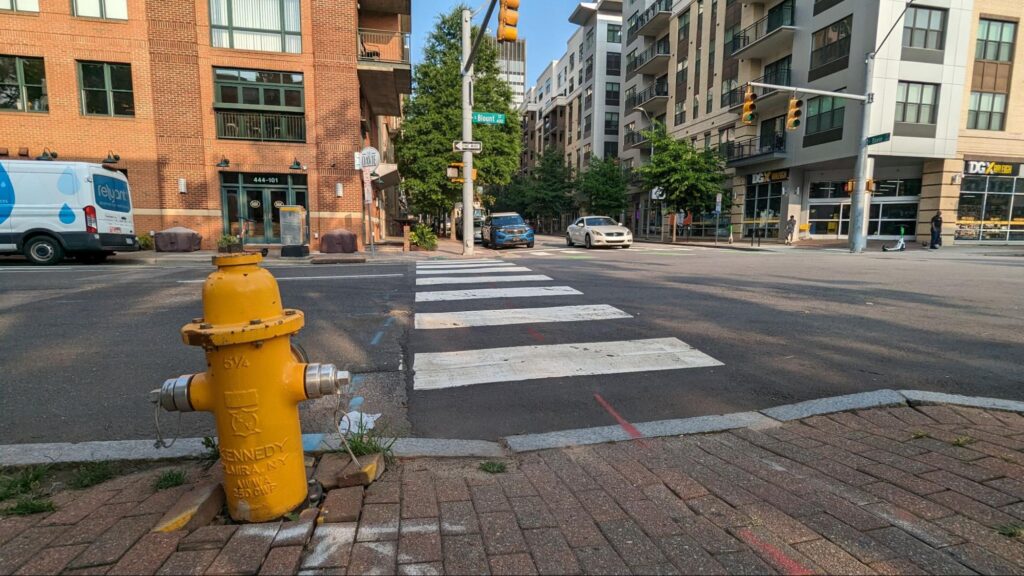
All throughout the cities of North Carolina and South Carolina, the development boom times have really kicked in within the last few decades. In most cases, this new growth in the South has led to car-centric development where driving a vehicle is almost required to navigate your city. For those able to drive safely, this has become part of Southern culture. However, not everyone can or wants to drive for their daily tasks. Our sidewalk networks, when present, pick up the slack here. For pedestrians with mobility challenges, high-quality sidewalks are a necessity.
OK. It doesn’t say that exactly but after seeing the tweet below, I couldn’t help but take a second look at the Downtown Raleigh Alliance 2023 Q1 report and count up those residential numbers.
Lately, I’ve been less active on the front-side of the Raleigh House of Connoisseur but have been heads down working with creating a new map. I don’t think I’m finished and honestly, haven’t even started any type of analysis, but I wanted to put an update out there and share something with readers.
I was inspired when I stumbled on this map of Paris, introduced by the tweet shown below. Technically, it was something I wanted to see if I could build for Raleigh but also, it would be interesting to see how the buildings of today have held up. Are we seeing “mass teardowns” as some people think? What other questions might we begin to answer?
Buildings of Paris from before 1800 vs 1800-1914. A reminder of how overwhelmingly what is widely celebrated in Europe's urban heritage is really the heritage of the long nineteenth century. From this brilliant database: https://t.co/fzXP1SFIQ0pic.twitter.com/8VAwR41mMK
I then found the “ingredients” on the city’s open data websites around Raleigh parcel data and using the “year built” field, I starting analyzing over 130,000 pieces of data.
The Map
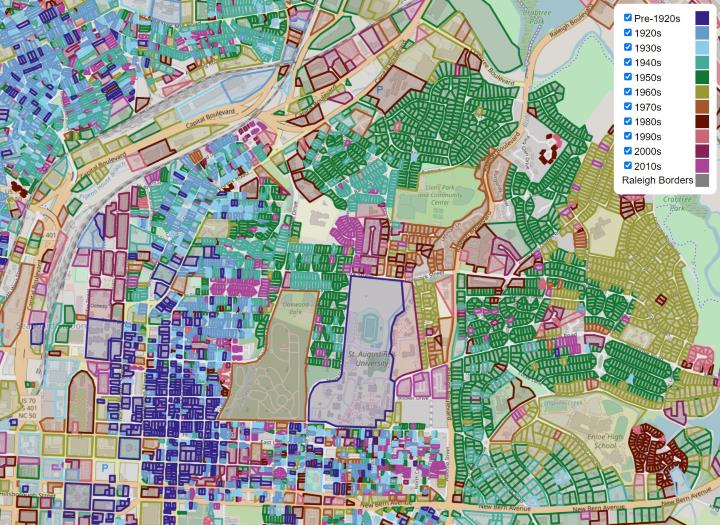
The map I put together shows Raleigh’s existing stock of buildings as of May 2022. It’s important to note that this is a snapshot in time, not buildings constructed over time. For example, if a home built in the 1950s was torn down for a new construction home in 2015, the parcel would show in the 2010s decade, not the 1950s.
Please note that the property shapes have been optimized so that the map is somewhat usable. Don’t take them literally.
I grouped properties by decades with an additional “Pre-1920s” category. This was driven mostly by number of buildings as the counts before 1920 is pretty low. Here’s a bar chart.
That it?
Probably not. I’m releasing it into the wild and see how it sits for awhile. We are discussing it on the Community on this thread so if you have any questions or thoughts, please join us.
I’m hoping to continue tinkering with this map and see what we can extract from it. Questions I have could be:
Are there neighborhoods that have been completely turned over?
Are certain neighborhoods less susceptible to teardowns than others?
Where do you see a mix of buildings being produced at a constant rate?
Why is the building count in the 2010s so much lower?
How might annexations and border expansions played a role over time?
How might protectionist overlays, like NCODs and historic overlays, played a role?
Embedded above (or here on YouTube) is the video of Raleigh Police Chief Estella Patterson presenting some data and observations about crime in Glenwood South for this year. The numbers are up and it’s been leading to concerns from nearby residents and the council overall.
The News and Observer started things off nicely:
The chief showed crime data comparing the 10 months leading up the pandemic and the last 10 months. Since June 2021, there have been 76 weapon violations, including 64 concealed weapon violations. That compares to 16 violations from June 2019 to March 2020.
There also is a sizable increase in traffic-related violations, but Patterson said the department increased enforcement and the number of traffic stops during that time.
Raleigh police chief makes recommendations to address rising crime in Glenwood South via newsobserver.com
The N&O article also has a graphic showing year-to-date (Jan 1 to Mar 20) figures from 2019 to 2022. Drug-related incidents are up as well as larceny and assaults. As expected, there is a dip in 2020 and 2021 due to pandemic restrictions and lockdowns.
Looking at these figures, I just had to see more as data from 2019 to 2022, with a pandemic right in the middle, may not tell us the whole story.
The Data
I went to the dataset, showing datapoints from June 2014, and built up my own app with charts and tables. You can dive into that here.
The site I built does the following:
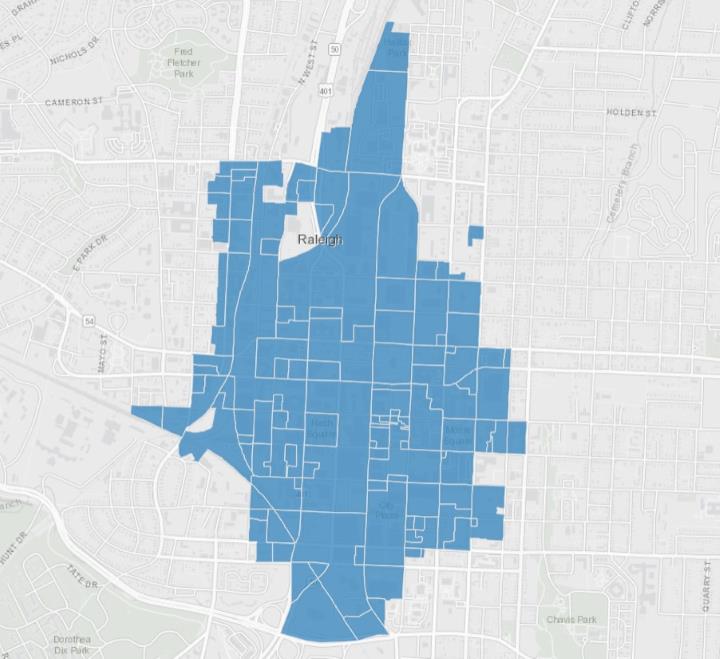
Shows the Glenwood South map and only takes in incidents that occur inside the boundary area
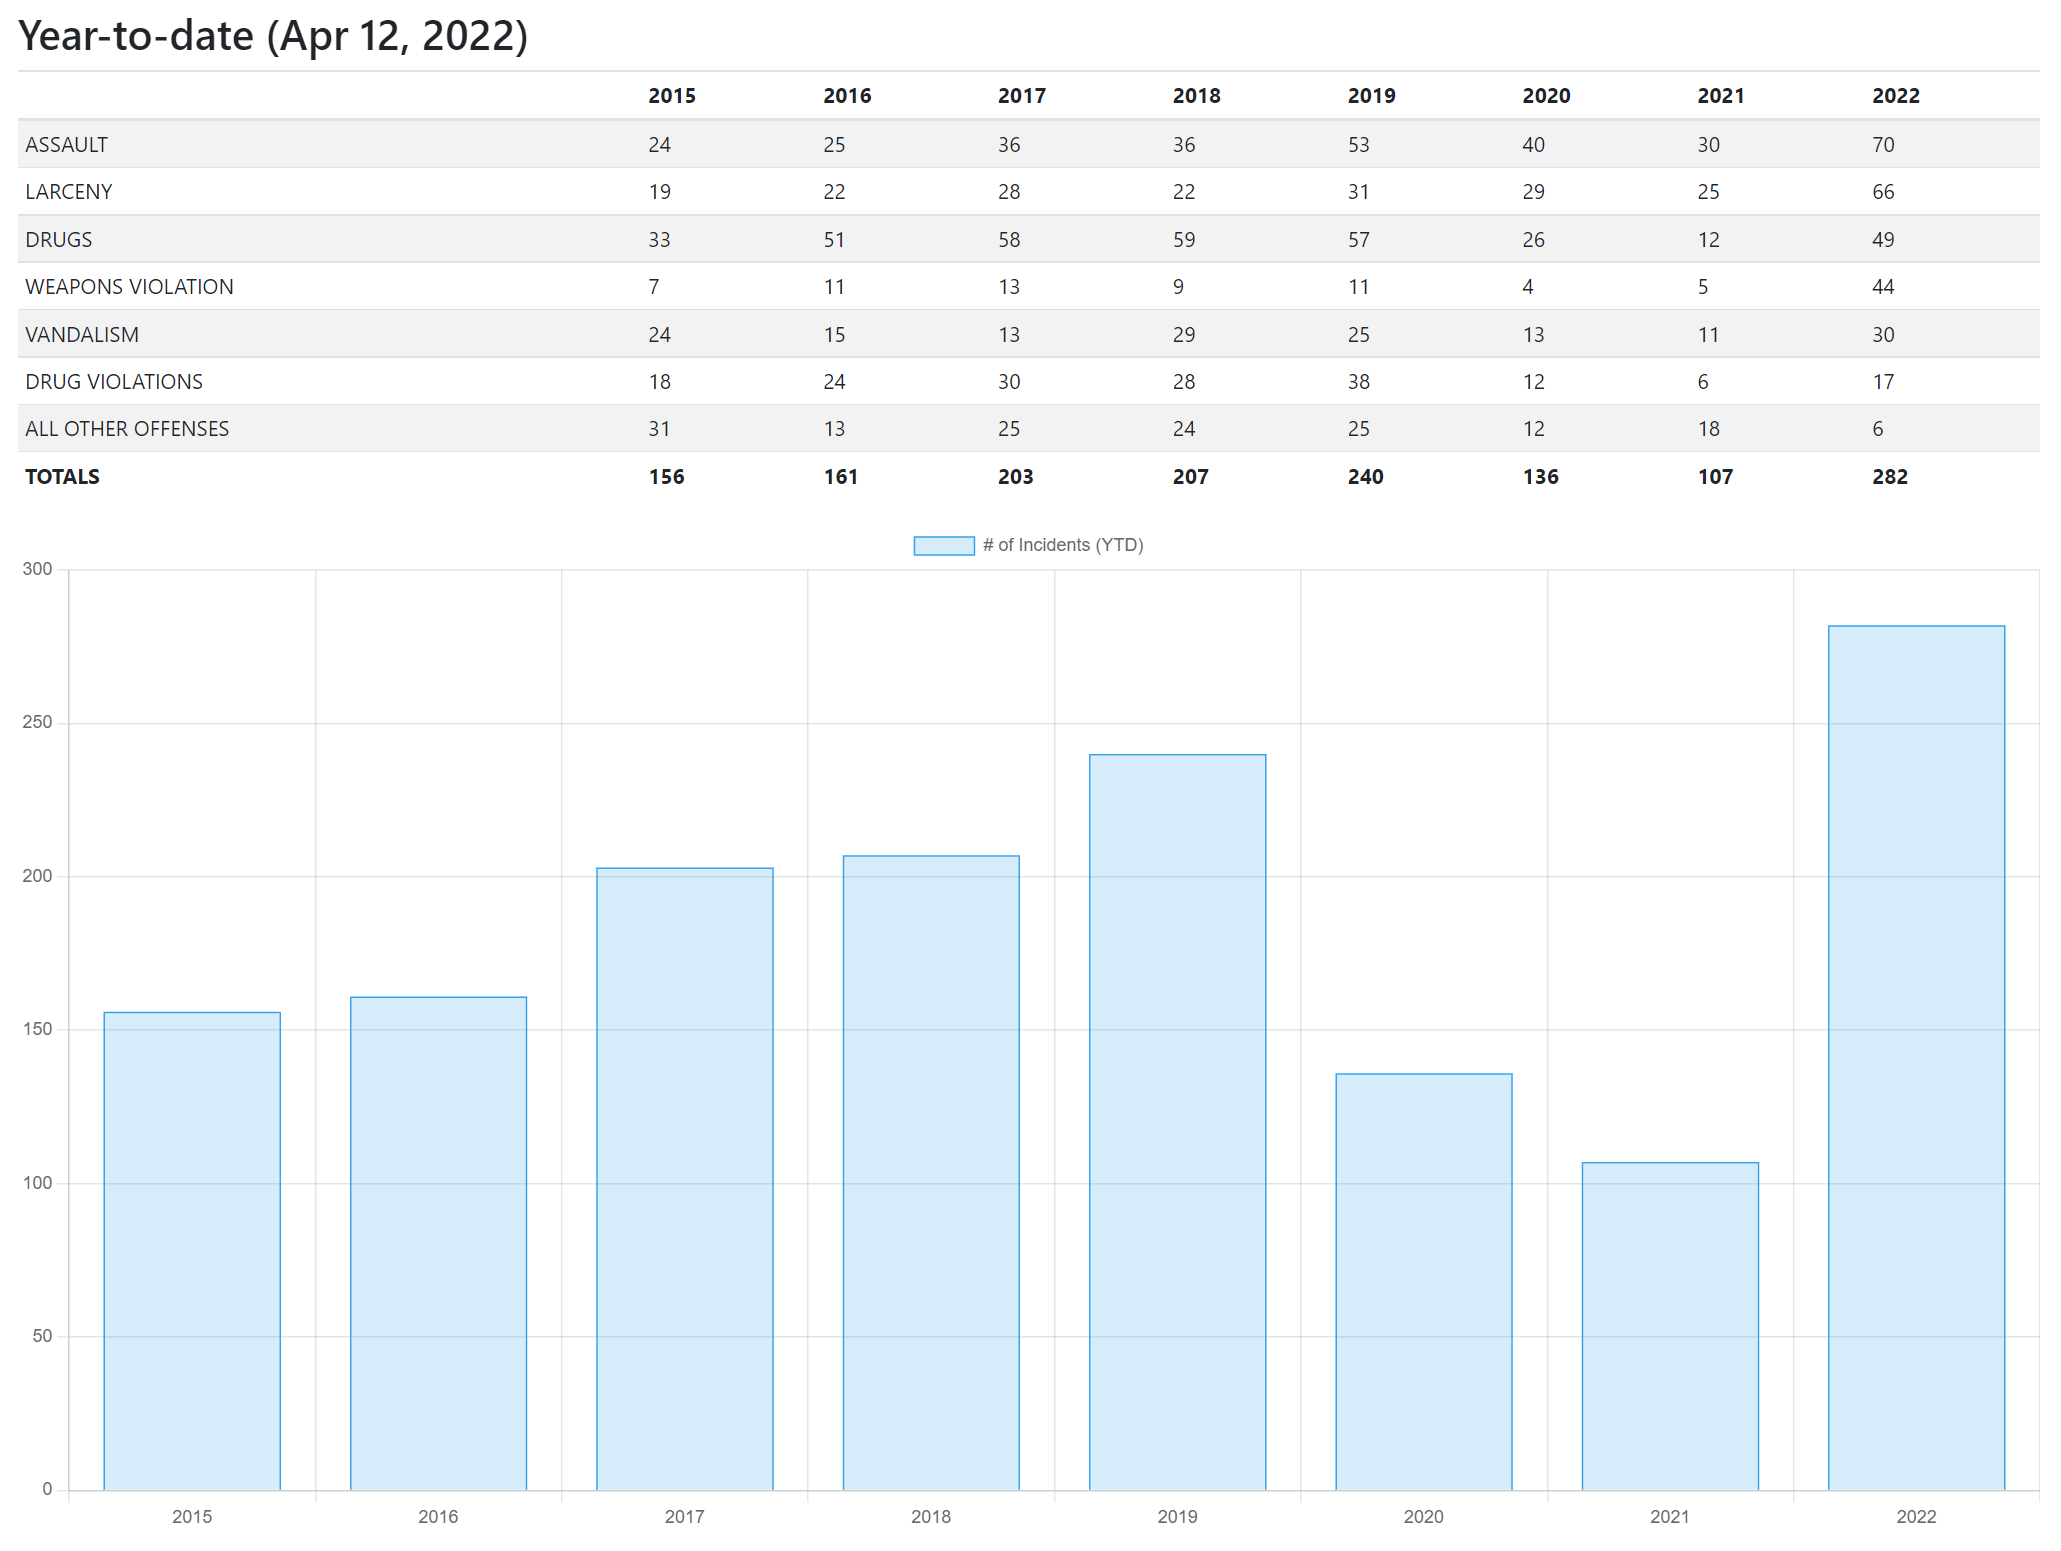
Year-to-date figures for top crime categories from 2015 to 2022
Displays Total Yearly Incidents by top crime categories
Displays Total Yearly Incidents for all crime categories
Pulls data nightly and updates the year-to-date figures
What I’m calling “Top Crime Categories” are the types of crime, as identified by the data, that when summed up, represent about 2/3 of the total incidents. The remainder incident types seem to be so few in occurrence that it’s hard to know if a trend is taking place. I’ll just remove those from the “Top” charts for now.
Top Crime Categories include:
Assault
Larceny
Drugs
Weapons Violation
Vandalism
“All Other Offenses”
Drug Violations
I guess I could have added up Drugs and Drug Violations but I kept the data “pure” for now. Also, I’m not sure what “All Other Offenses” means exactly so this one might qualify to be ignored. Take it for what it’s worth.
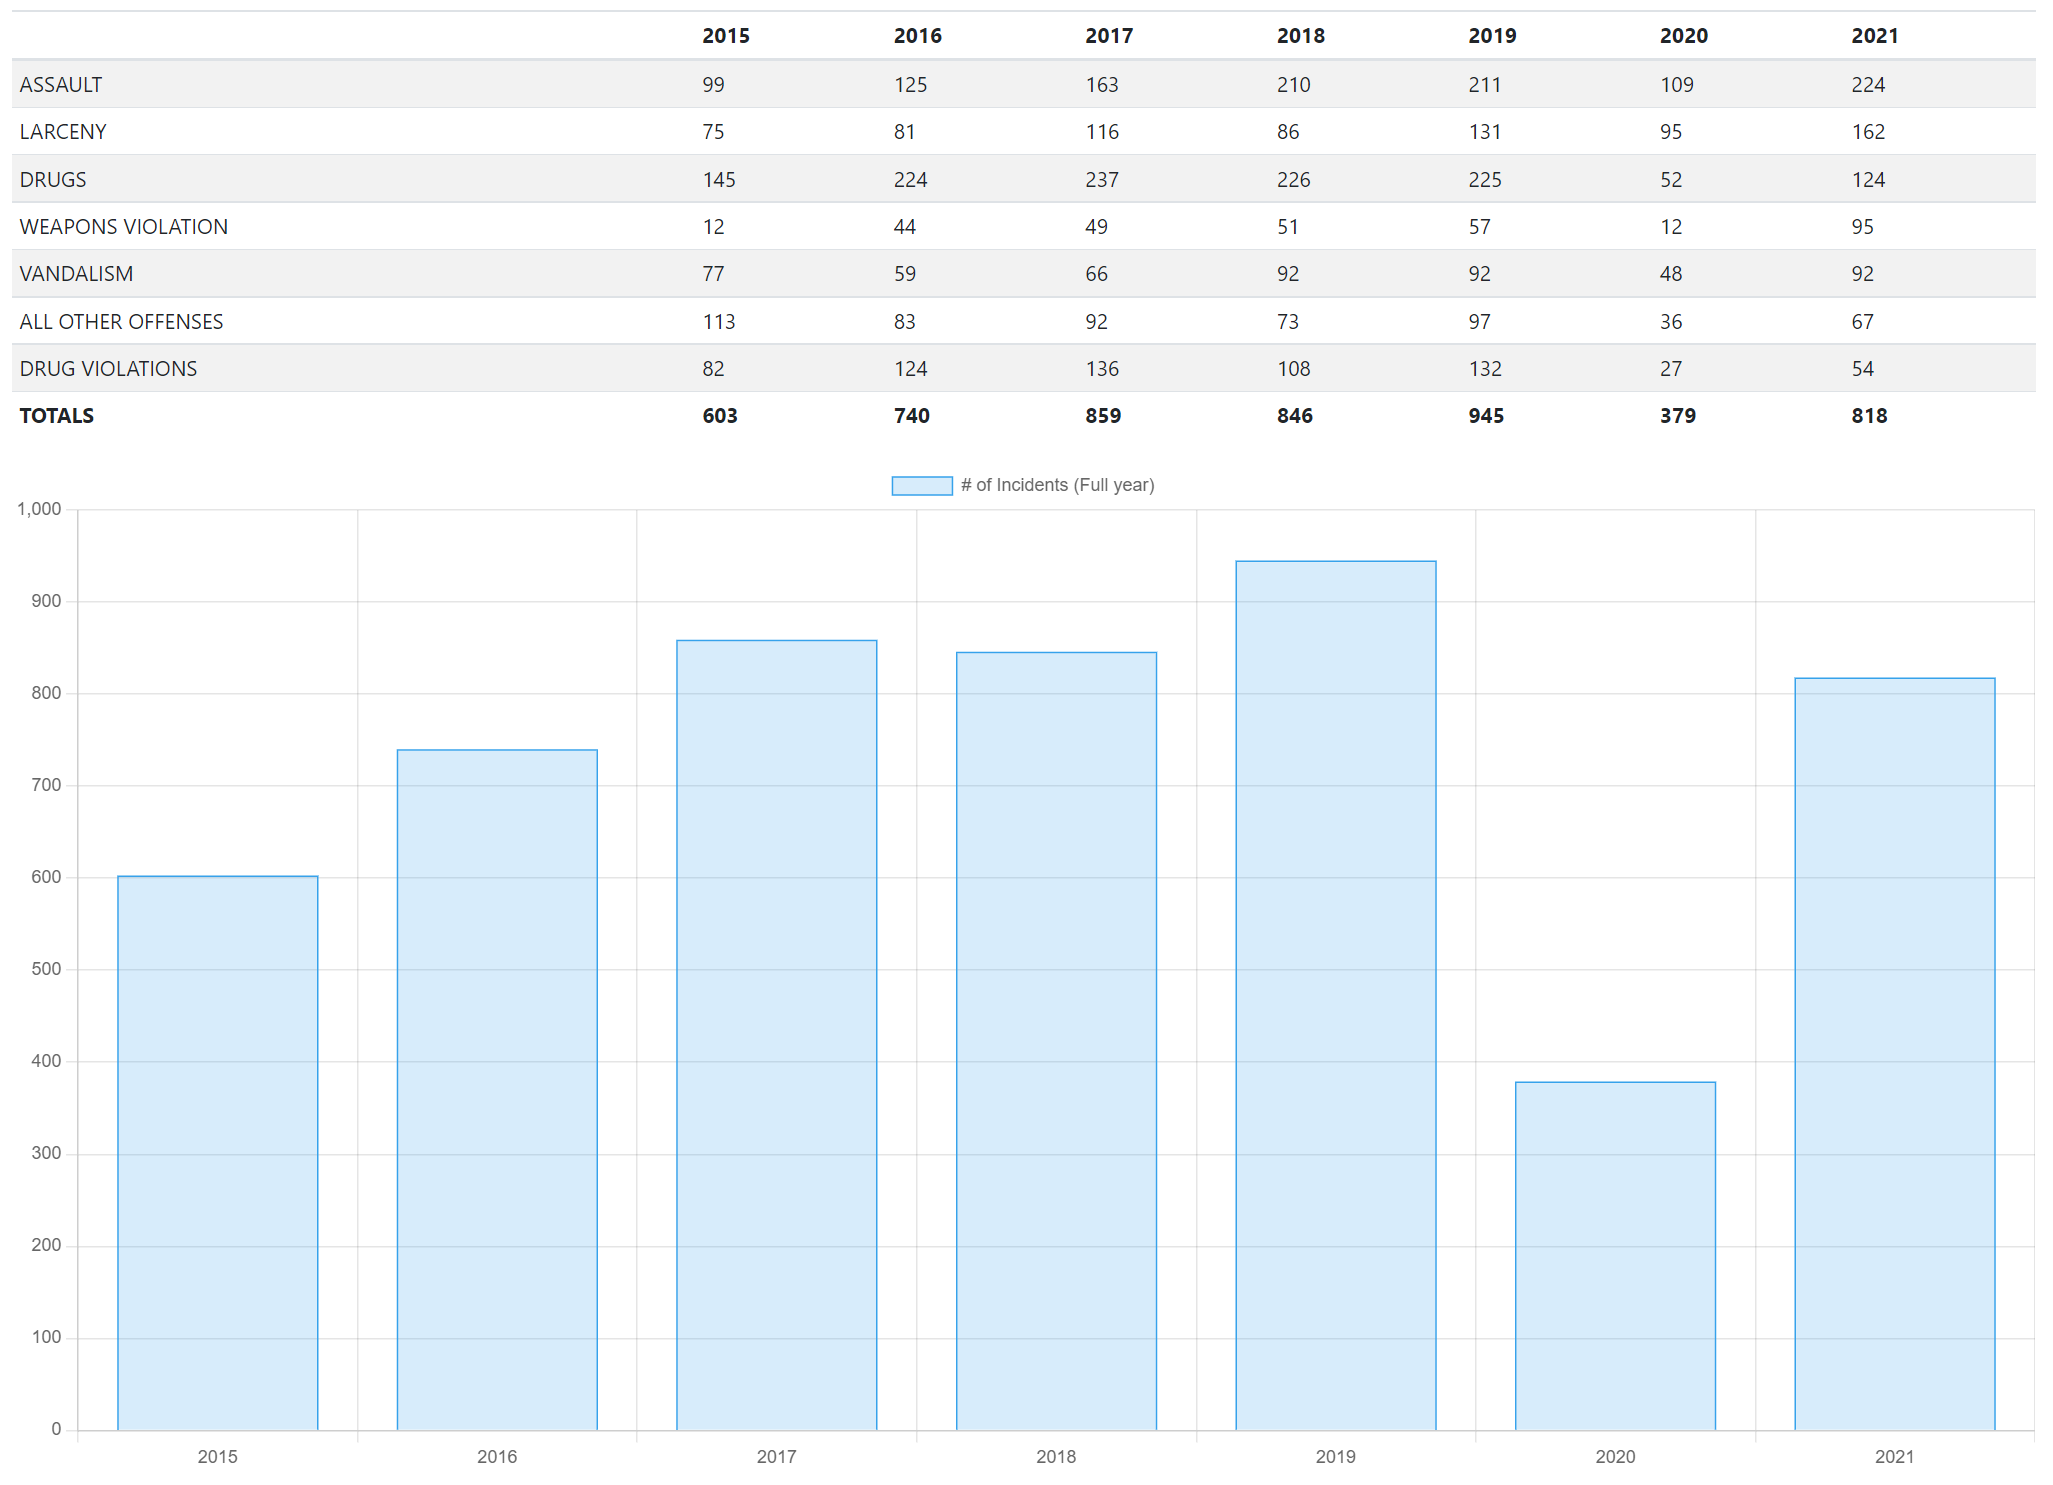
Last thing to point out, I start with 2015 as the dataset starts in the middle of 2014 so a partial year isn’t helping that much. 2015 is great as we get five full years before the pandemic lockdowns took place starting in March 2020.
Yearly Totals
Indeed, when we look at just the top crime categories as well as all crime categories, the number of incidents has been increasing since 2015. It actually went down in 2018, not by much, but continued on its trajectory in 2019.
Again, the big drop in 2020 is most likely due to the pandemic lockdowns and we can see the recovery in 2021. If we remove 2020, some items to note:
number of assault, larceny, and weapons incidents have increased
number of vandalism and drugs are more of less the same
“all other offenses” has gone down
I’m not sure we can figure out what’s going on but there are some things to note. Consider that since 2015, more development has taken place. The number of residents have increased and the number of restaurants and bars opened has increased.
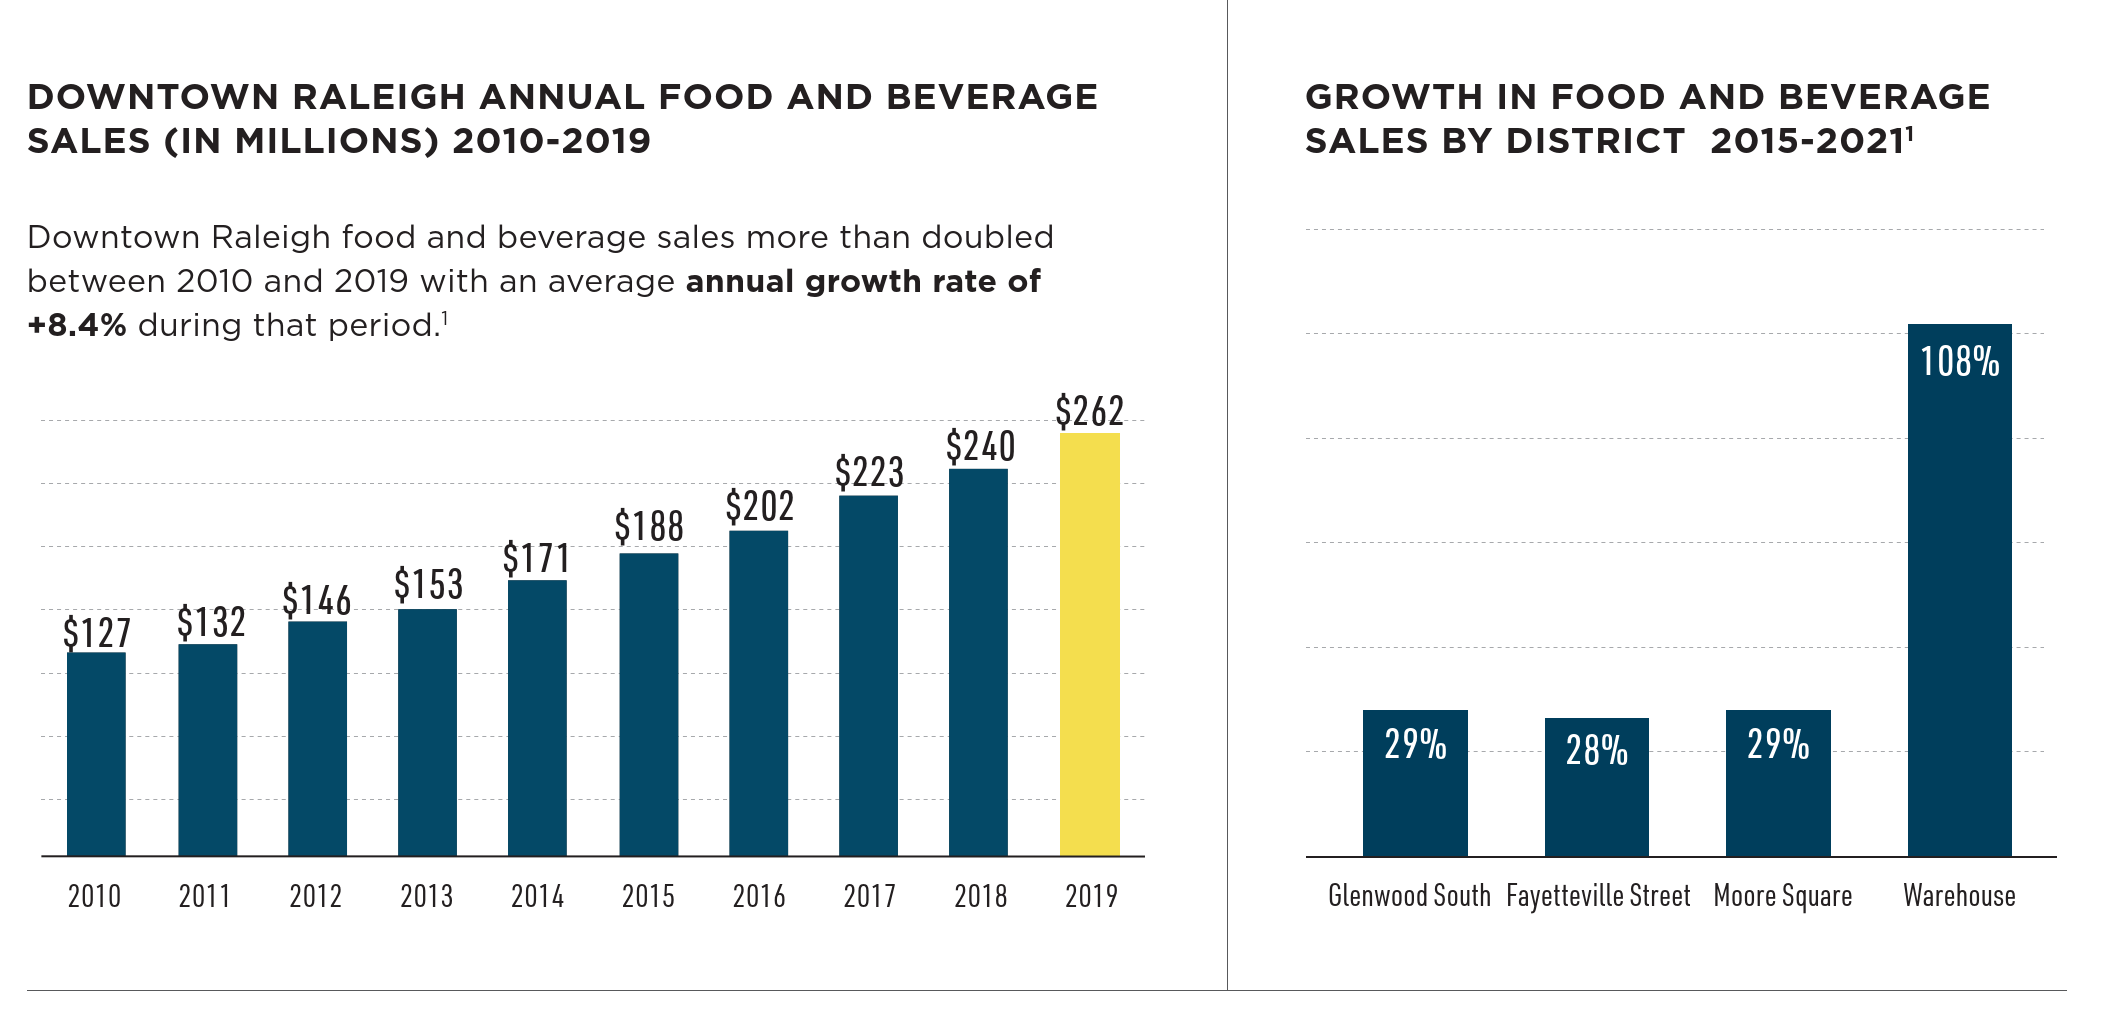
Does increased food and beverage sales lead to more crime? Not necessarily but if we think for a moment that there are more people in Glenwood South, leading to more F&B sales, we could argue that more people in a district could lead to more crime. The above figures show a 29% growth in F&B sales from 2015 to 2021 for Glenwood South. In addition:
From 2015 to 2021, Glenwood South had an 18% increase in crime incidents overall
From 2015 to 2021, Glenwood South had a 36% increase in TOP crime incidents
The real comparison, saved for a later post most likely, is to compare this activity with other districts.
Year-to-Date Figures
The app tracking the data runs nightly so if you want to check back later this year to see how we’re doing, you can do just that. Here’s the snapshot up until April 12, 2022.
Year-to-date figures are pretty much in-line with everything stated above so I’ll leave it right there.
Final Thoughts
The police chief had some suggestions to try and curb this increase in incidents including adding metal detectors at bars as well as changing Glenwood Avenue to a one-way street to keep car traffic flowing more smoothly. A catastrophic incident is not something anyone wants so it’s a good idea to keep an eye on the trends.
We’ll see if any changes come from the city to try and smooth down these numbers. What I really want to see is a comparison of this activity and the number of incidents to other areas to get a sense of context. That’s a post for later this year perhaps.
Things have been slow at DTRaleigh HQ with some recent holiday downtime. (I hope the same for you as well) Also in the background, I’ve been flexing my tech skills a bit and working with maps lately. I went down a rabbit hole with the zoning information on the city’s open data website and started thinking about building heights.
But first, a refresher.
For the longest time, Raleigh’s zoning code had two limits with regards to building height; number of floors and the measured height in feet. To a certain degree, the “height in feet” limit has been removed and today, only the number of floors is the limit we care about. That may not be true city-wide but seems to be for downtown Raleigh, where we see a concentration of floor limits as high as 40.
Since this is a downtown Raleigh blog, let’s look at just that. Downtown is, generally, given the DX zoning type. You can see a map of all zoning in Raleigh here but if I filter on just downtown, it looks something like this.
After filtering the dataset and looking only at the ‘DX’ zoning type (DX = Downtown Mixed-use) we can see areas that we generally refer to as Downtown Raleigh and shapes on a map with different zoning. To quickly read zoning labels in Raleigh, the formatting typically goes in this order:
Zoning Type
Maximum height allowed
Frontage type
So for example, when I see ‘DX-5-UG’, that stands for ‘Downtown Mixed-Use with a 5-story height limit, Urban General frontage’ There are a bunch of frontages that are worth going over but that’s for another day. Today, I’m looking at that middle number only.
I wanted to get a sense of what the maximum heights allowed are but the map above doesn’t show it to me easily without clicking every shape and noting the zoning. I went ahead and created this map below which shows darker shading on areas that allow higher heights, such as 12, 20, and 40 story maximums. Conversely, the lighter shading indicates lower heights including 3, 4, 5, and 7 story maximums.
The map is using the same dataset from the city so it should be up-to-date whenever you look at it.
It’s probably obvious to guess that the tallest height allowances are around Fayetteville Street. Two Hannover, with the newly renamed Truist Bank on its crown, and the Wells Fargo Capitol Center have been around since the early 1990s. When you add in PNC Plaza, opened around 2008, the thought of our city’s tallest towers and where they are doesn’t surprise anyone. Taller towers nearby are allowed and could come to this area in the future.
The map does show some easily explained anomalies such as the five-story maximum at Martin and Fayetteville. This is where the historic post office sits and since that’s not going anywhere any time soon, a rezoning just seems silly. Open space on Moore, Nash, and Union Square follows the same principle with their 3-story maximums.
If you are following me so far, you may think that the tallest towers in downtown have always been, and may always be, situated around the core business district around Fayetteville Street. That seems like a trajectory that downtown has been on since we started calling it downtown Raleigh.
However, there are other districts that now have 40-story maximum zoning. I say ‘now’ as these have been approved within the last few years. If I take my map and filter on only the DX zoning type with max heights at 40, we would get a visual that looks like this.
In this map, we can see two clusters of 40-story max zoning outside of the traditional downtown core of Fayetteville Street, those being the warehouse district and the northern end of Glenwood South. If we look at the effective dates of the zoning in these two areas, they are all in 2019 or later.
Just a side note, from the data for the whole city, it looks like the rollout of the newest zoning per our development ordinance was throughout 2016 so while we see some zoning in downtown effective as of 2016, there’s a lot of it across the city. I want to say this was the transition from the old zoning codes to the new ones so anything with a 2016 effective date was not a market-driven zoning change more or less.
The maps above show current zoning and doesn’t consider active cases under review. As of this writing in December 2021, we can further show this clustering activity if we consider the in progress rezoning cases in downtown shown in this table.
You can see that the first four cases listed above show more height in the same districts with three of them within these new clusters at the 40-story max height. Glenwood South and the Warehouse District are poised to really add much more space.
Why might this be happening? Is this an accident? Actually, it’s all according to plan.
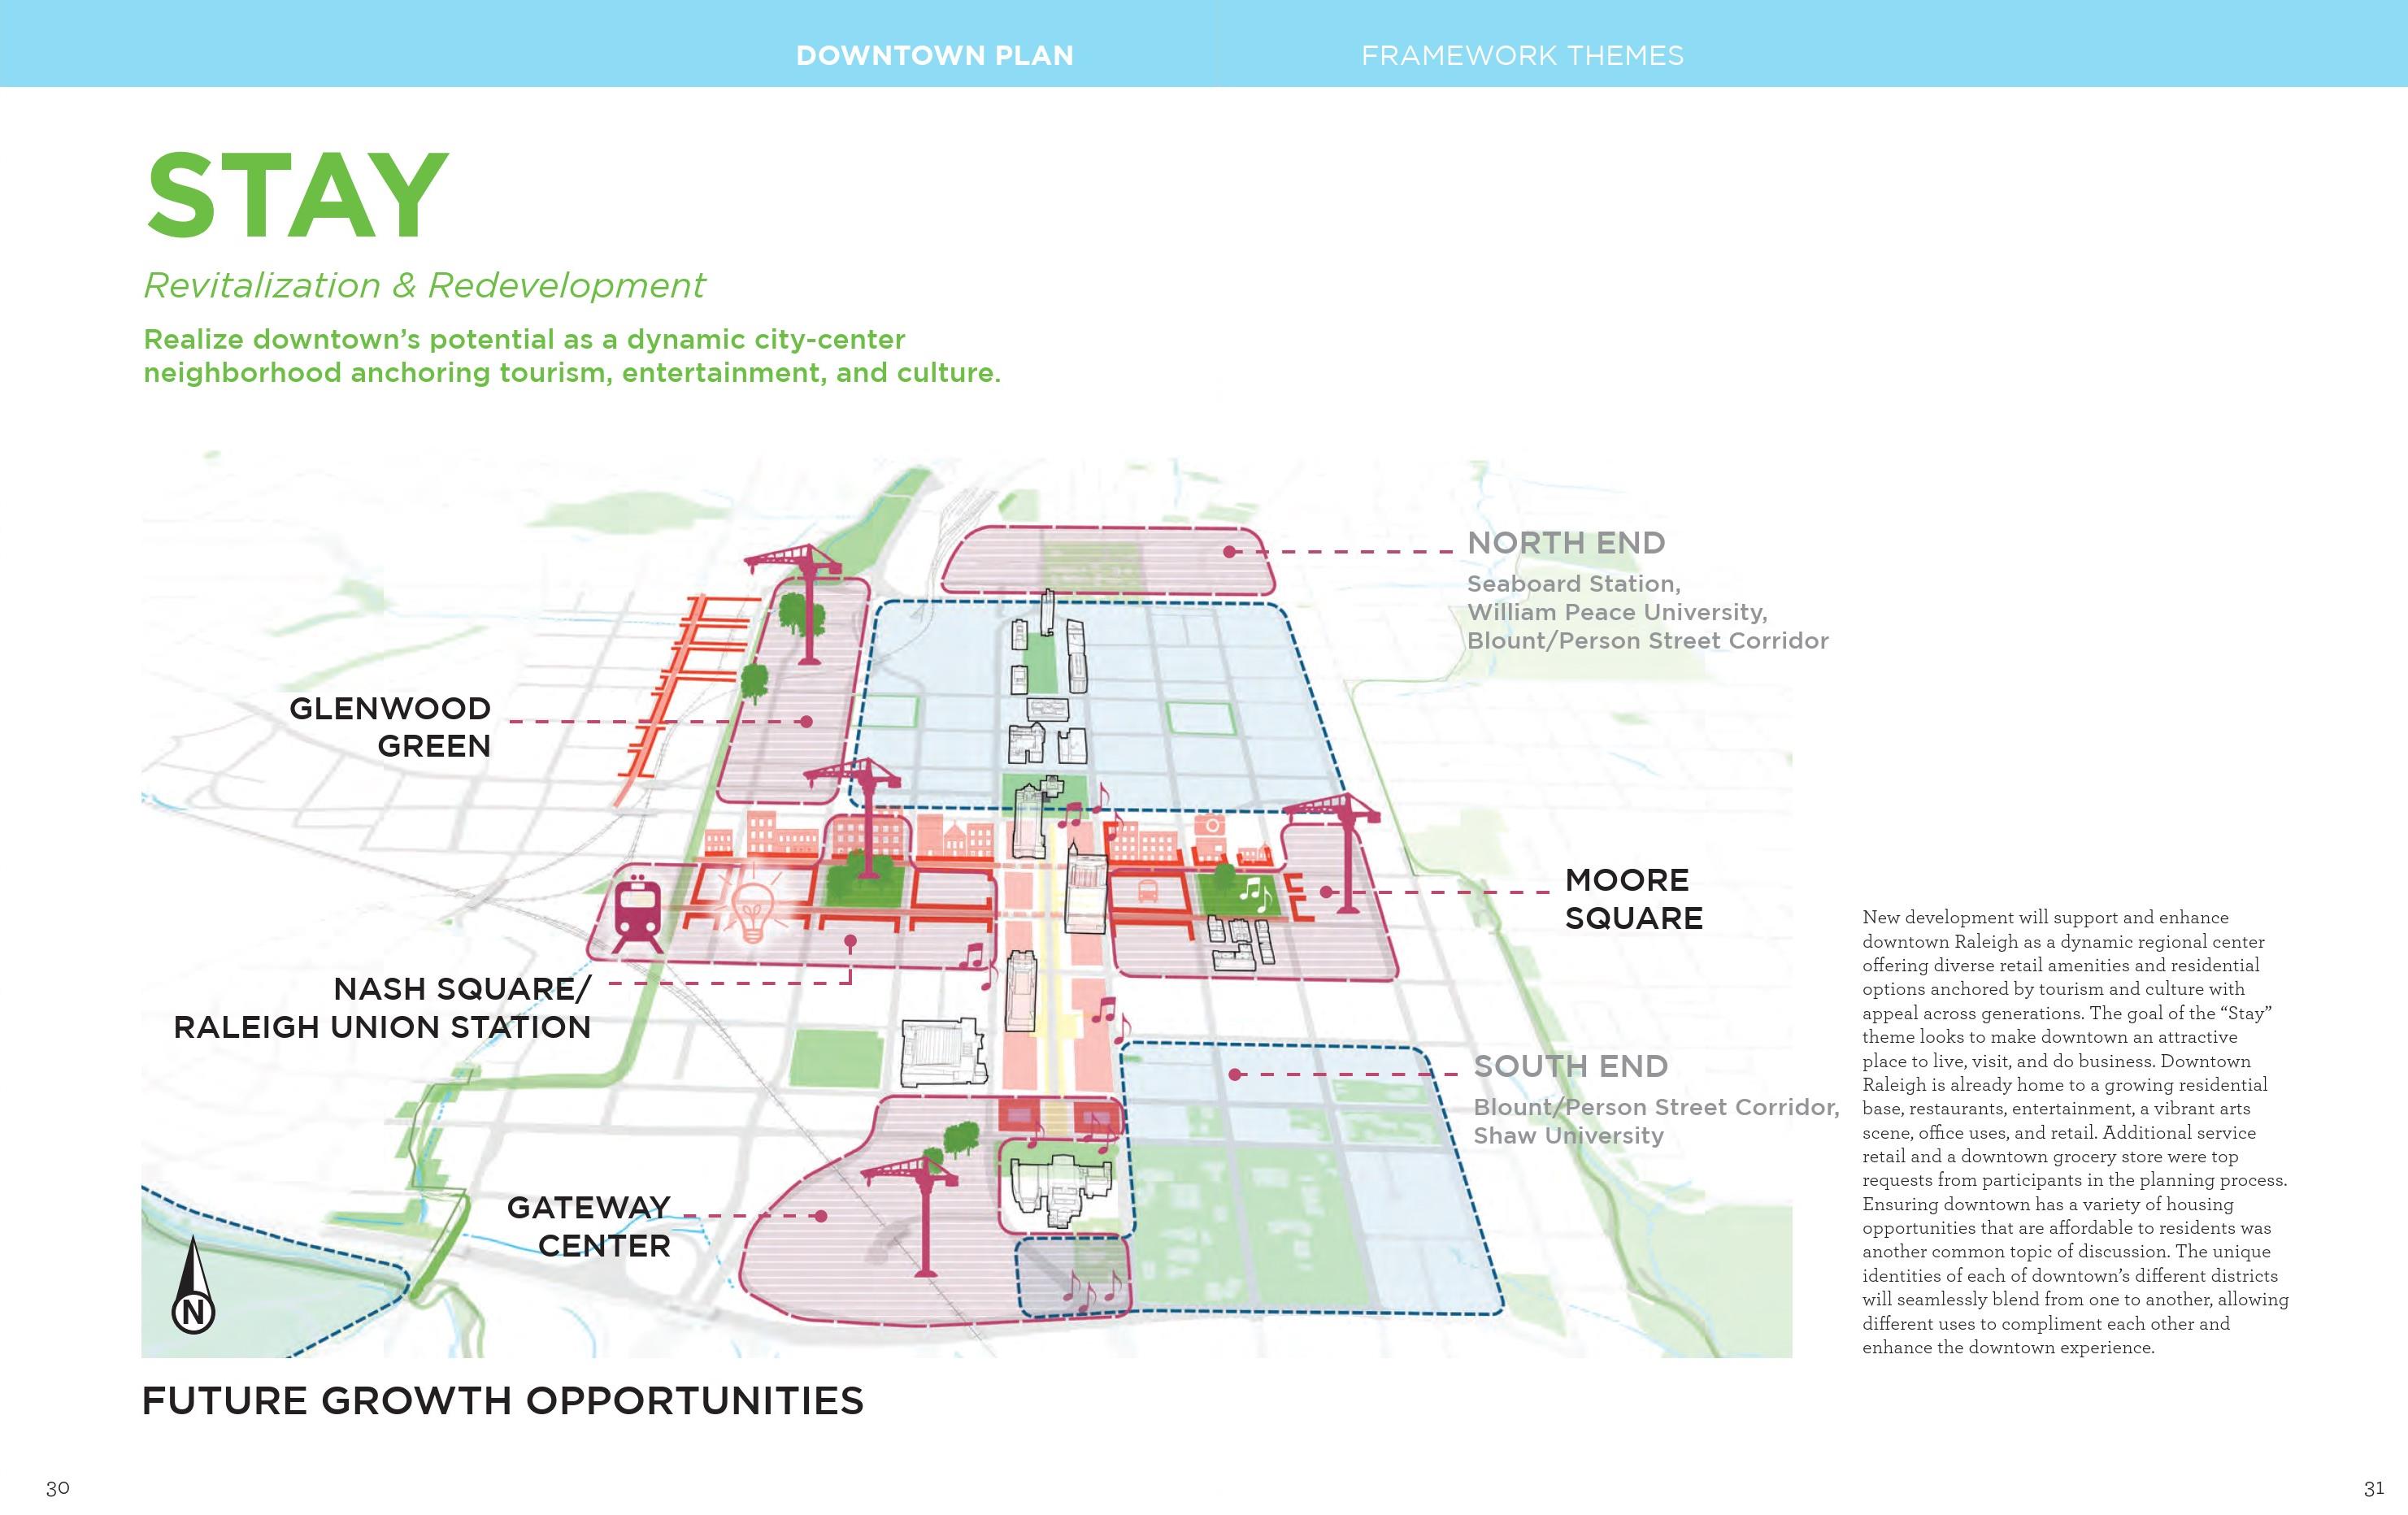
Adopted in 2015, the Downtown Experience Plan has many recommendations in it and a subset of redevelopment recommendations suggest we are right on track. You can dive into the plan here. (pdf link) I mean, this image alone from the plan is spot on.
We have talked plenty about the downtown plan over the years, which you can revisit here, and it’s recommendations say they are for 10 years. Perhaps later this decade it’ll be time for a new one?
I could keep going with thoughts about all this rezoning. Remember that maximum height doesn’t mean the buildings are built that high. Also a 20-story residential tower is shorter than a 20-story office tower. Zoning seems to be enjoyable to the civic geeks out there because of all these nuances, am I right you all?
There’s also a pretty wide gap between the 20-story max zoning and 40-story max. If a developer only wants to build a 23-story tower, they must apply for that 40-story max. Height conditions may be a thing of the future as the eastern most shape on that map above, the one by Marbles, has a condition limiting it to 30 floors. (Nuance!)
The main takeaway that I think I’ve gotten at is that we all need to be watching the Warehouse District and Glenwood South as they may really see a jump in development this decade. If these rezoning cases to new heights seem like a drastic change, just look back and see that it’s all part of Raleigh’s plan.
Every Spring, the Downtown Raleigh Alliance releases their “State of” report and it’s full of data goodness about our city’s core. If you want to dive into it, go here.
Having seen a few of these, there are some stats that I go for each year and I wanted to put them down here for Part 1.
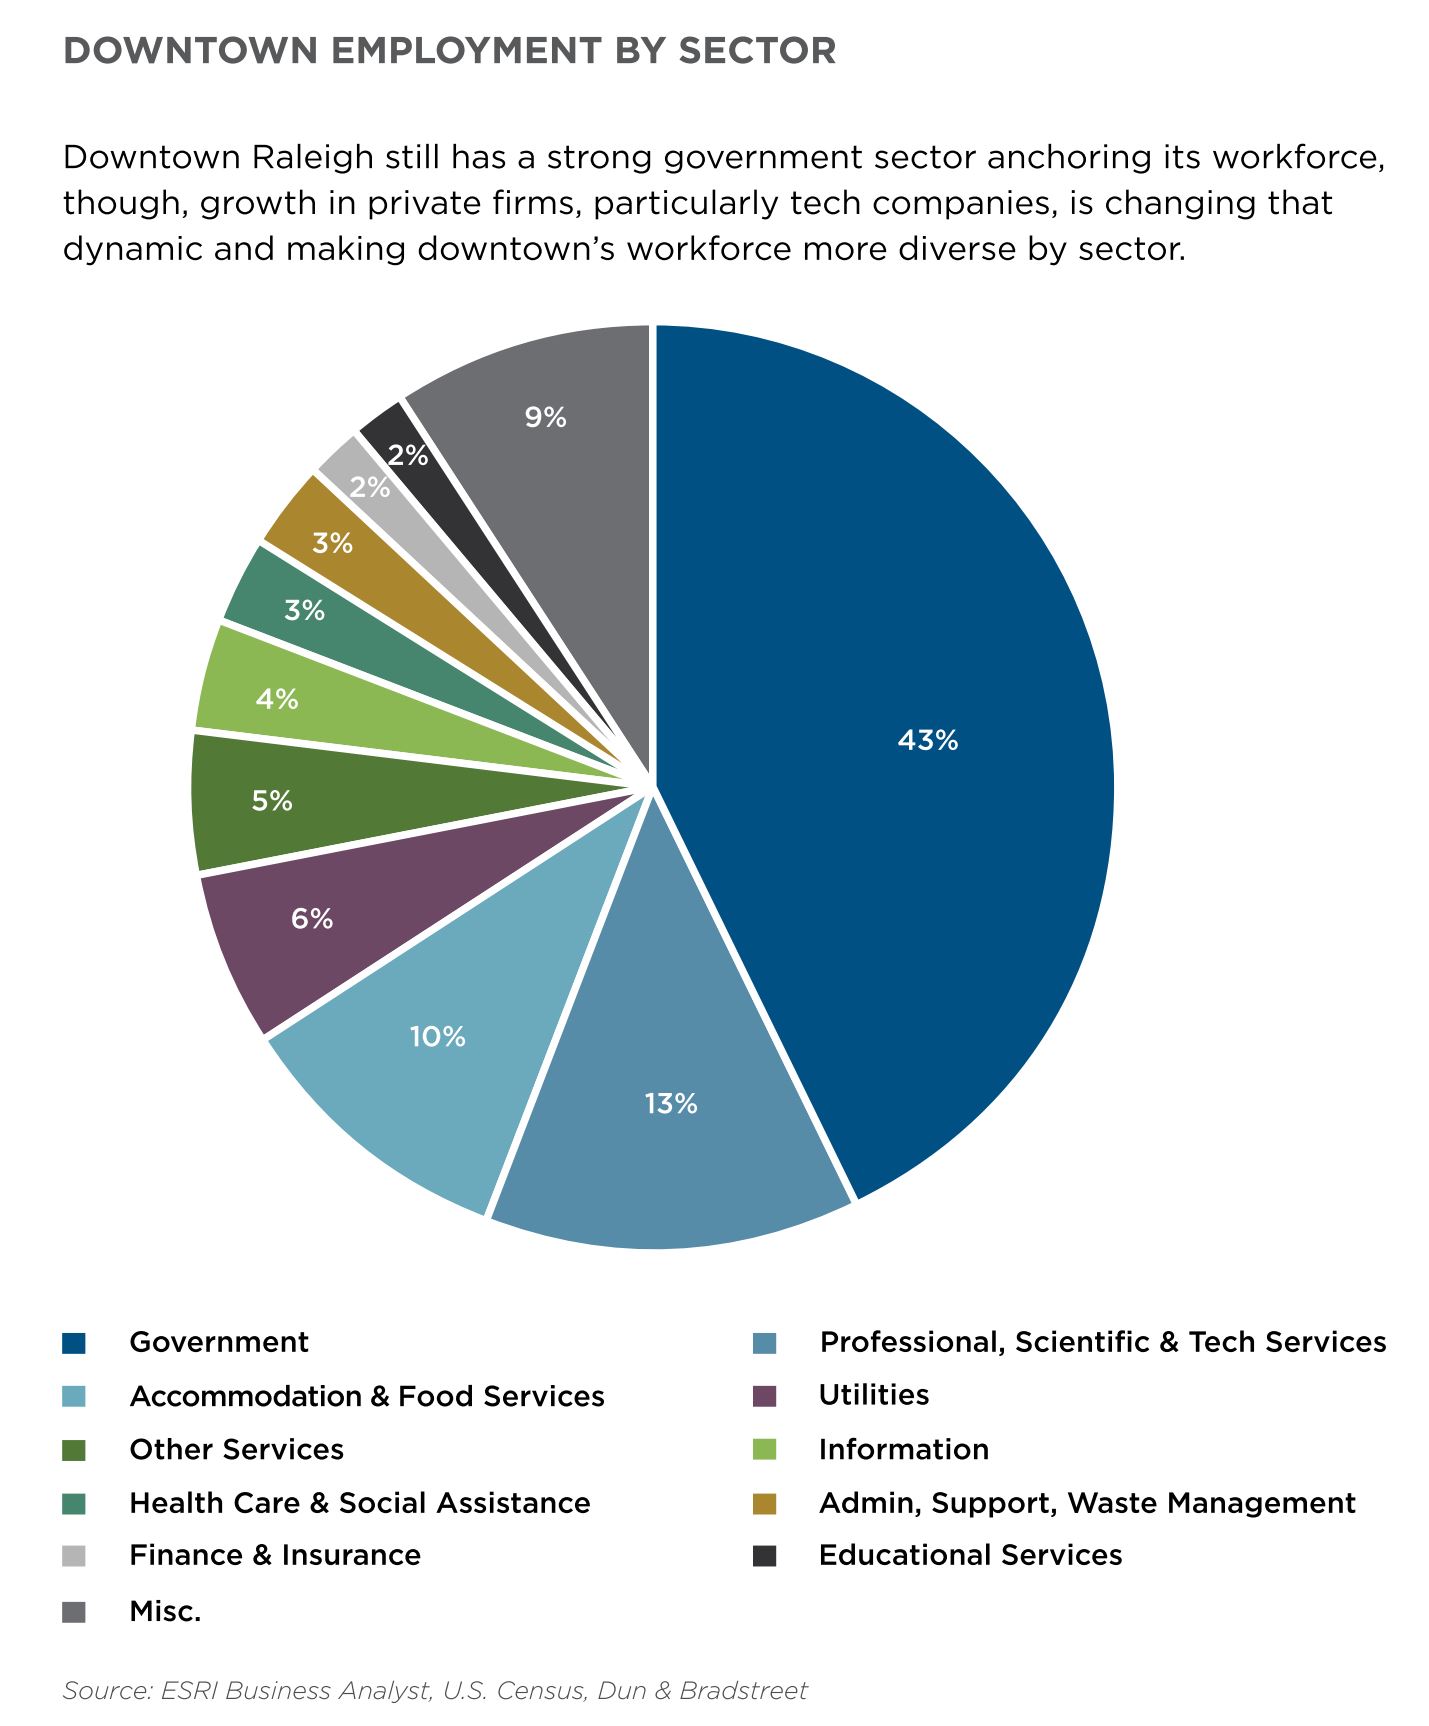
Employment
Government everywhere.
We’re still a government town and the figure below shows the latest breakdown of employment by sector.
Downtown Raleigh has the densest office market in the Triangle. The count of urban workers is now at 47,000 and is projected to be at 56,500 by 2030.
Compared to last year:
Government went up 1%
Tech is up almost 2%
Accomodation and Food Services is up 1%
The rest more or less went down a percentage point.
Population
8,500.
There are now 8,500 residents living in downtown Raleigh and we’re projected to hit 10,000 by 2022. The occupancy rate is also at 95%, up one over last year so we’re ready to absorb more units.
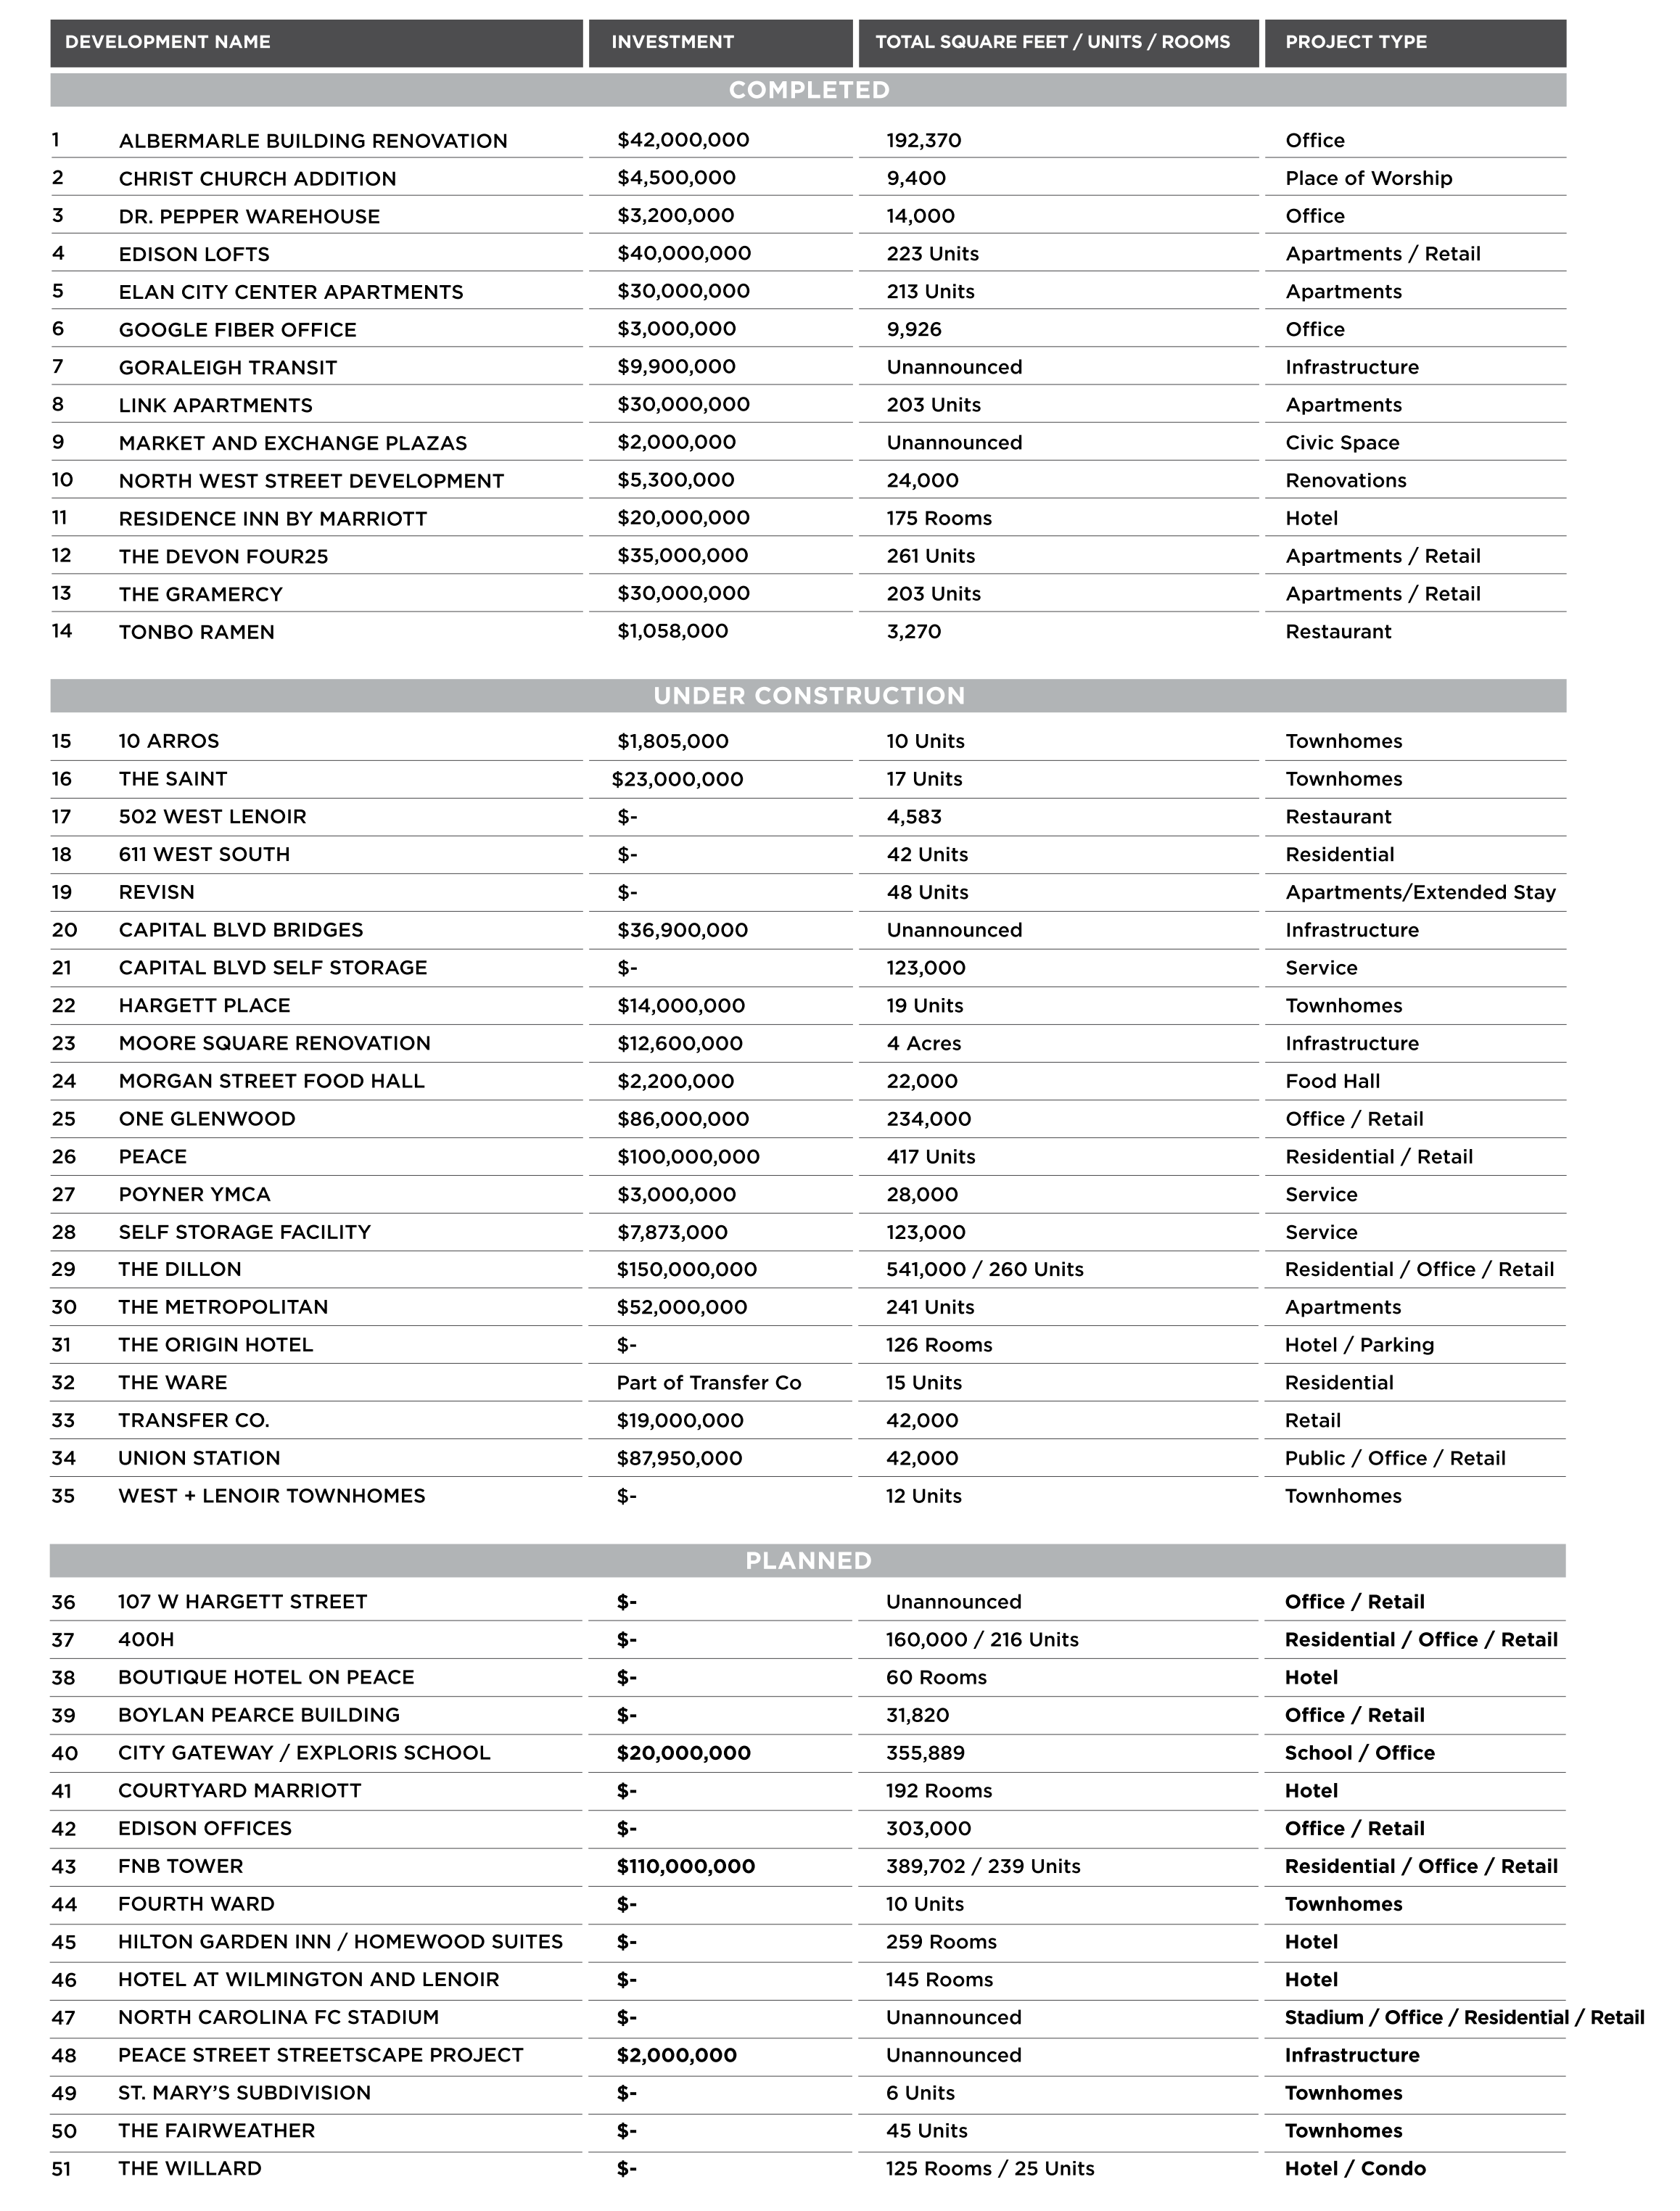
List of Projects
And finally, here’s the big list of developments from the report showing completed, under construction, and planned projects in downtown Raleigh.
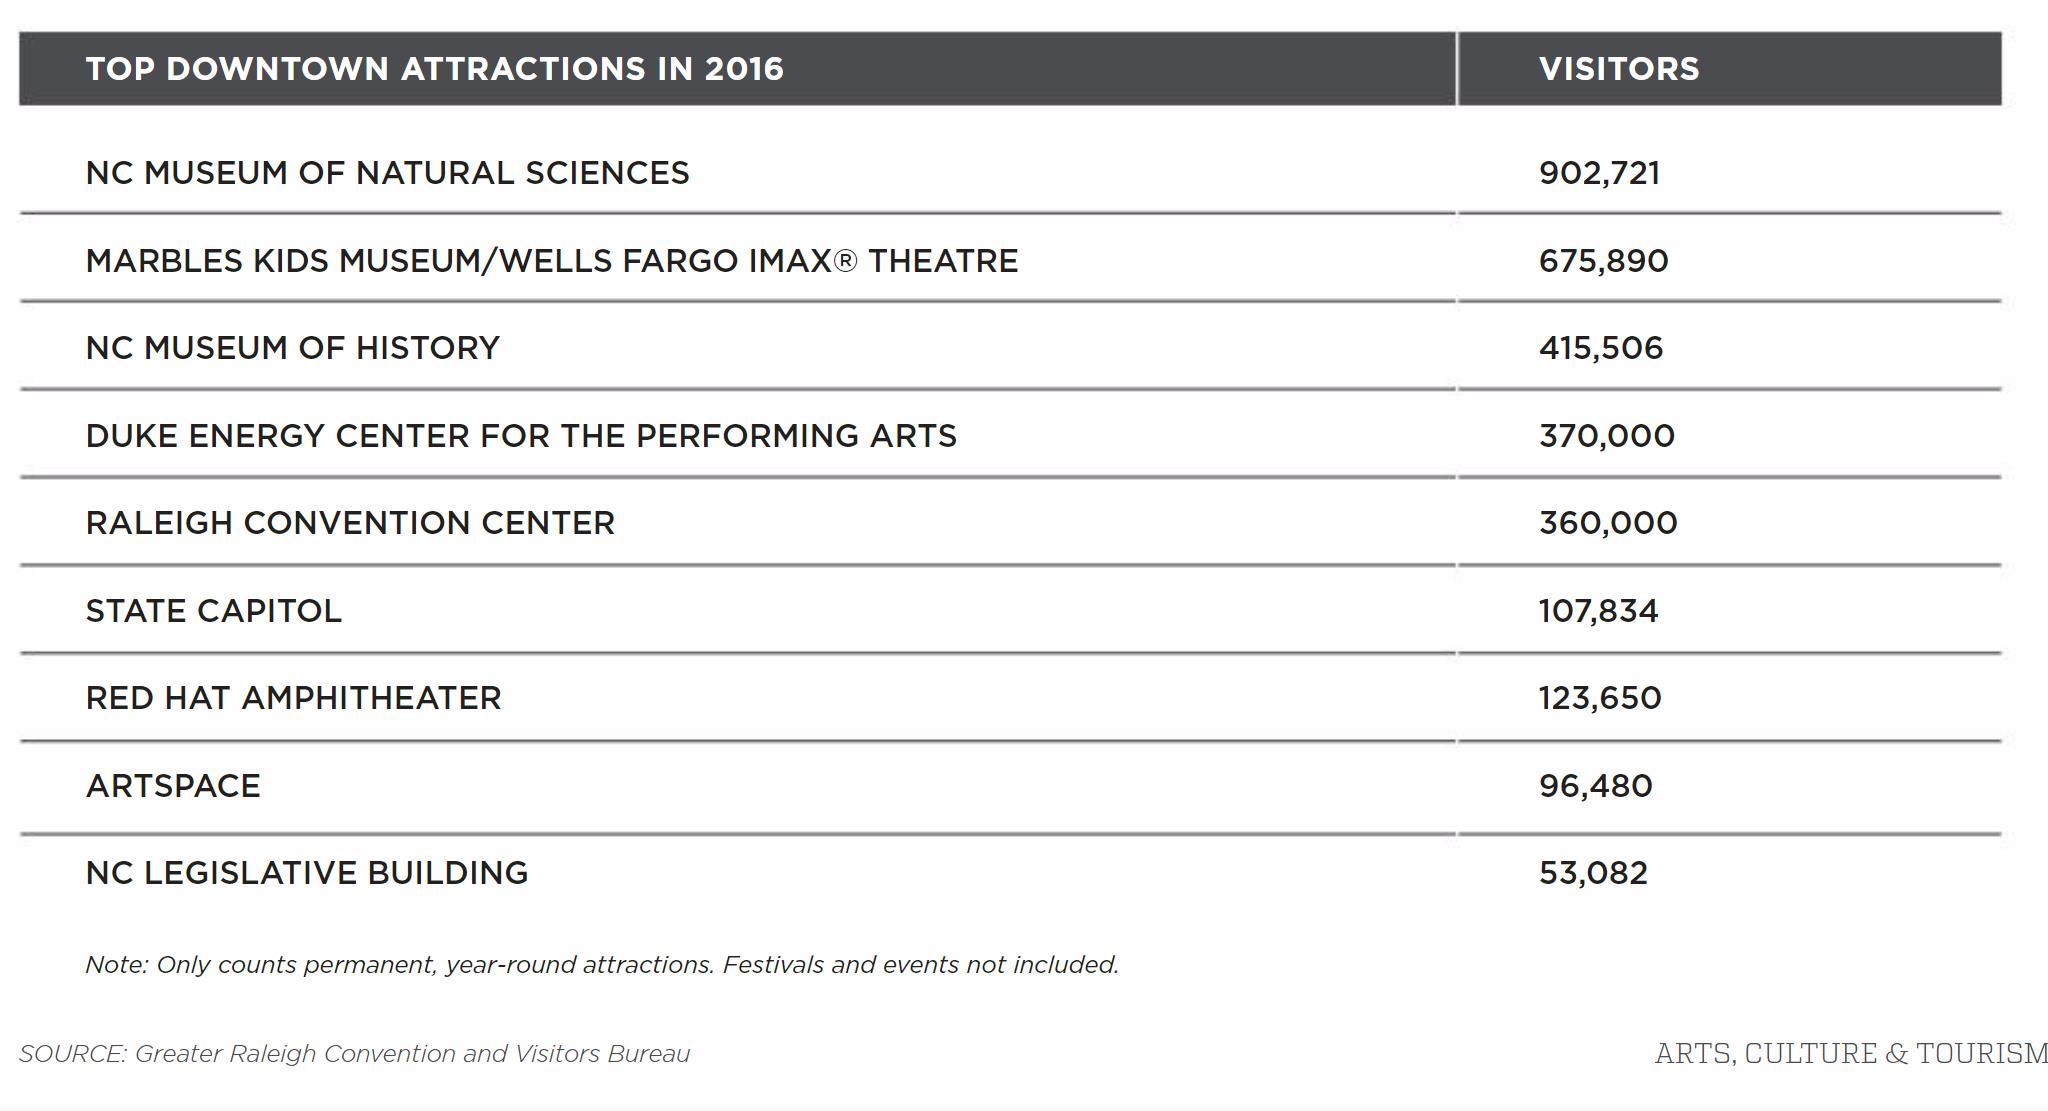
Our final “visit” to the 2017 State of Downtown Raleigh report focuses on visitors and retail. Jump back to this tag to review some of the other things discussed from this year’s report.
The above figure shows the top attractions in downtown Raleigh. For years, the NC Museum of Natural Sciences (NCMNS) has been at the top of the pack. It doesn’t hurt to have a state-wide draw, putting it in the top visited sites in the entire state.
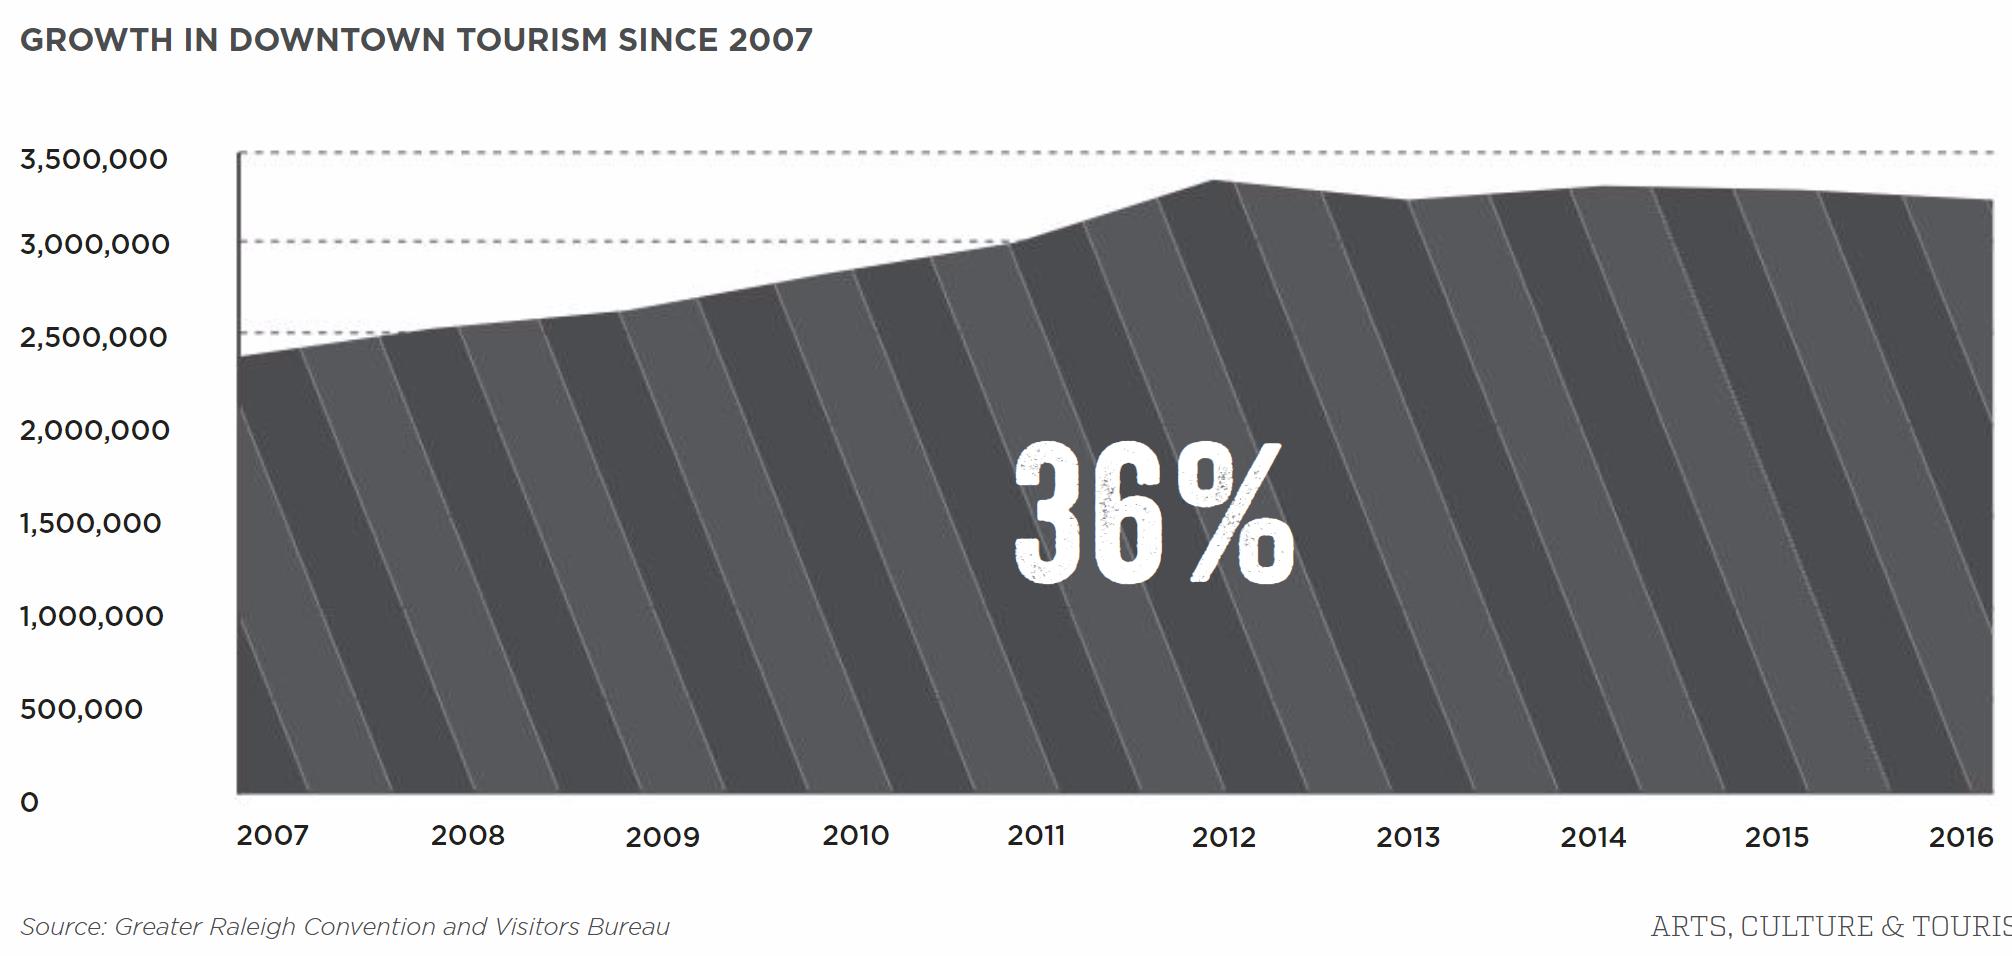
Tourism in general depends on how you look at things. Since Fayetteville Street opened, 2007, the numbers have gone up by 36%. There seems to be a peak in 2012 with things leveling off more recently.
With the Nature Research Center opening as part of the NCMNS in 2012, that could explain the bump in that year. It may have “cooled off” after opening leading to the decline. In recent years, there hasn’t been any major openings or attractions to really ramp up visitors, ones that count the crowds anyway.
With events growing more and more, and numbers not reported in this figure, that, as well as other factors, may be at play here.
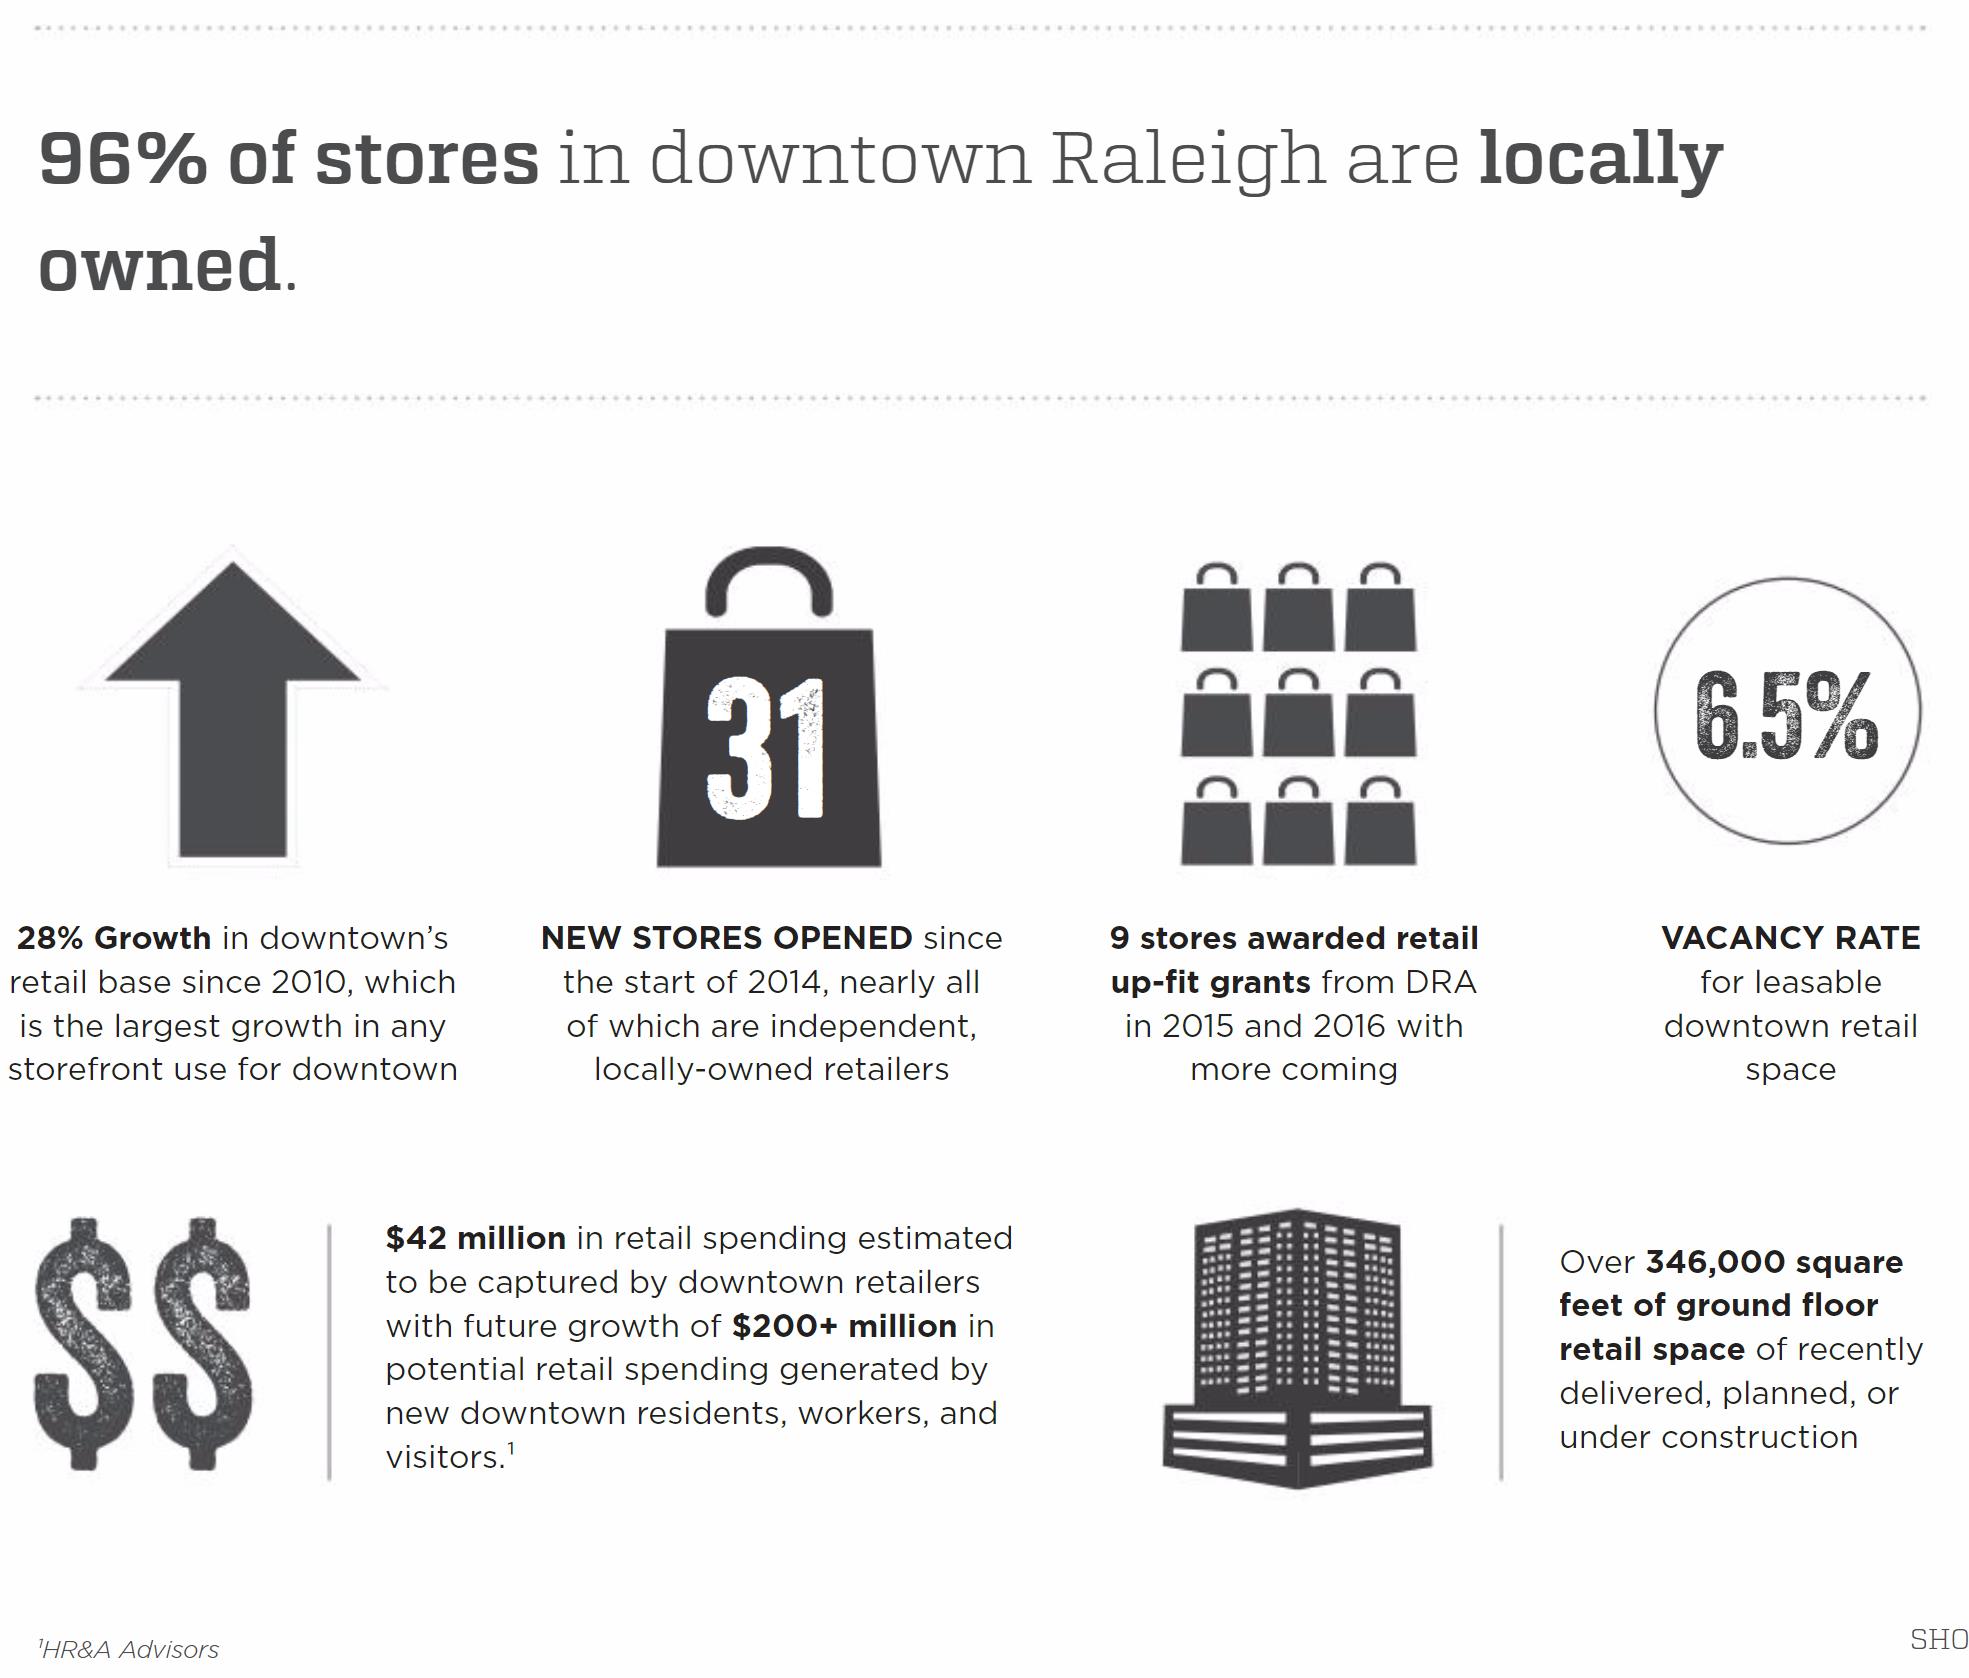
On the retail front, the report states a 28% increase in shops since 2010, most being independently owned.
At 96% local, you won’t see me complaining about a national retailer setting up to create an “anchor” for more increased traffic. I feel we have plenty of room for something bigger to come in and really inject more retail spending in downtown.
There isn’t anything too exciting with these figures but that could change once we hit that magic threshold that enables the big box stores to seriously consider downtown Raleigh.
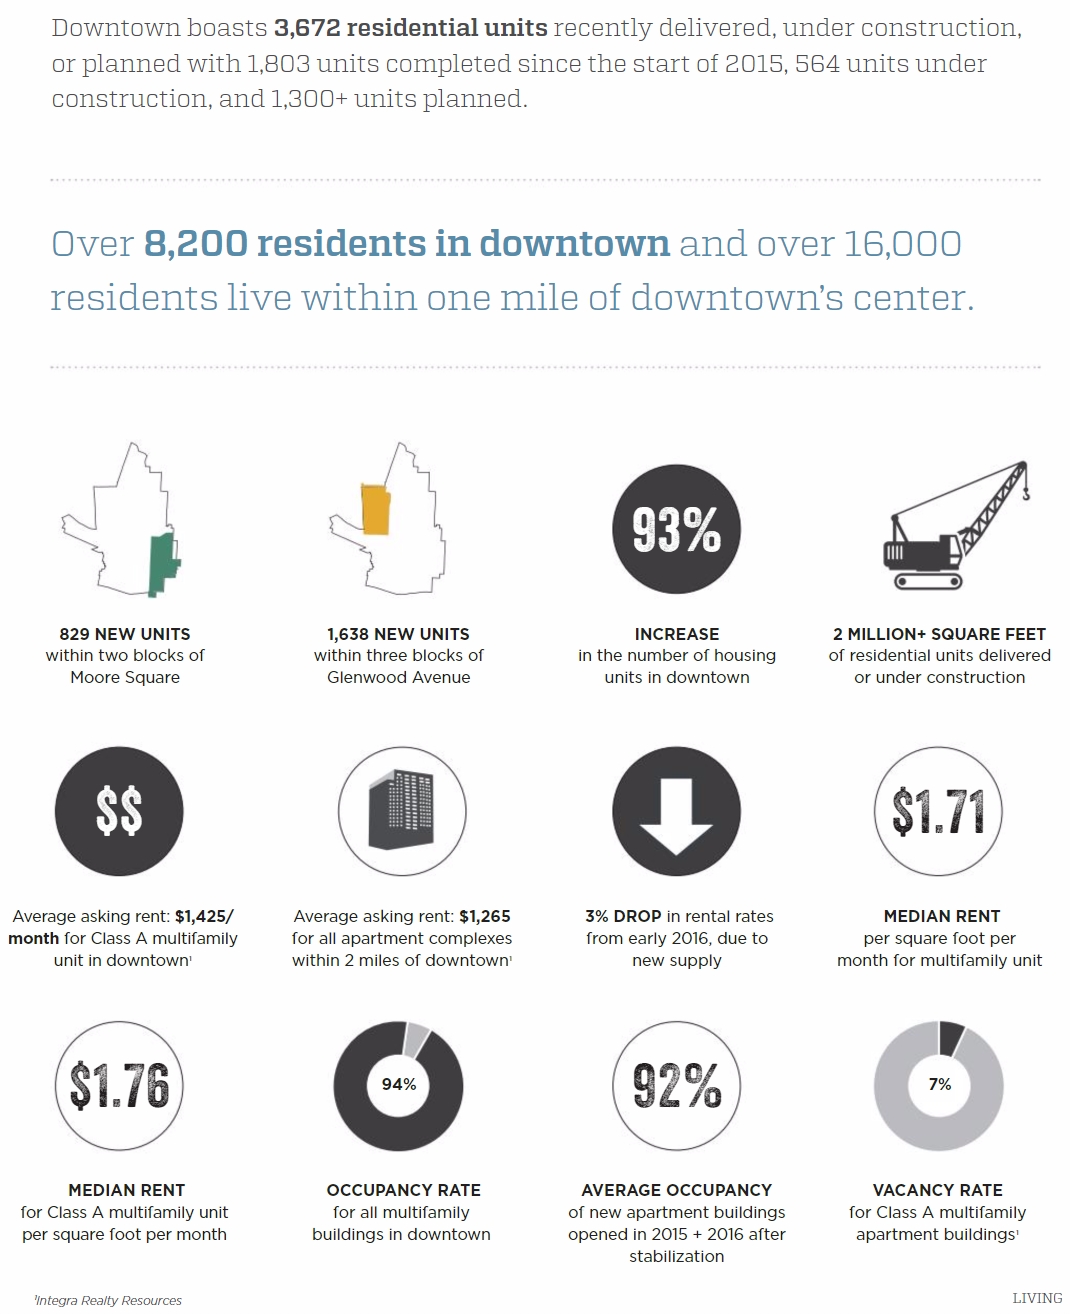
Taking a look at more stats from the 2017 State of Downtown Raleigh report, there are a few that cover the residential trends in the area. The graphic above offers some highlights including:
8,200 residents now live in downtown Raleigh
Average asking rent is $1425/month in downtown
Average asking rent is $1265/month within 2 miles of downtown
7% vacancy rate for multifamily apartment buildings
My take on it is that downtown residential is still in high demand and supply is trying to meet it. There are more units on the way which will help meet that demand and bring more residents to the core. The report states that rents are down 3% compared to 2016 so maybe supply is keeping up to a degree.
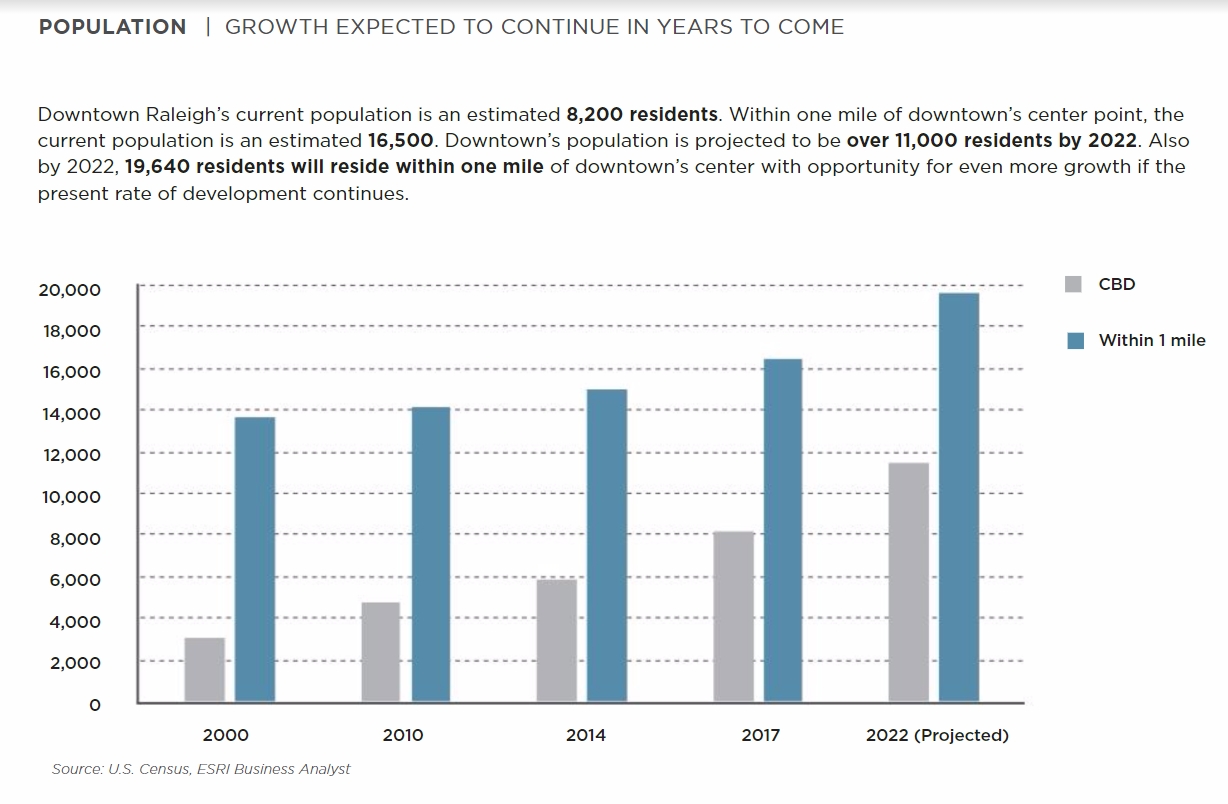
Predictions on when we cross 10,000 residents?
The chart above projects 11,000 residents by 2022. By then, we’ll have the Capital Boulevard bridge work completed and parts of Smokey Hollow finished. If those projects are very successful, more may follow in that area adding to the resident count around 2022.
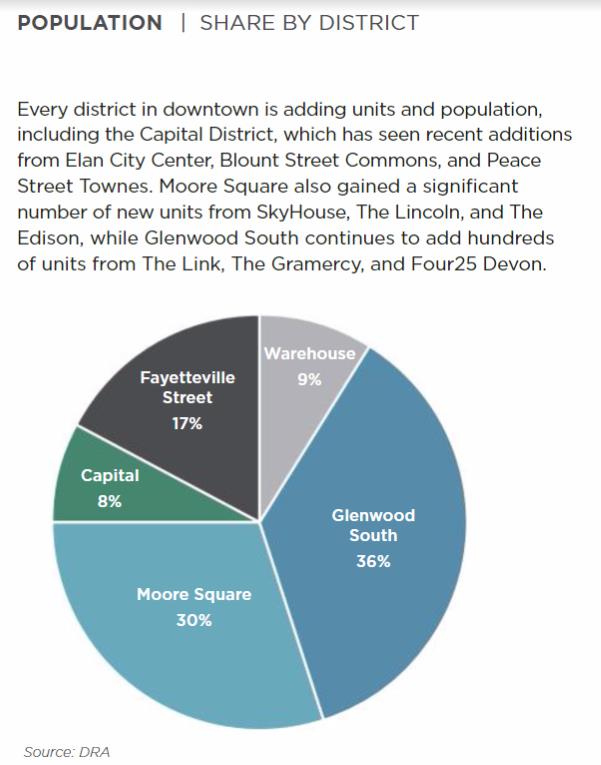
The population breakdown by district shows much the same as past years. Glenwood South is the leading home for downtown residents. Recently, Moore Square has had a big infusion of residents with Skyhouse, The Edison, and The Lincoln openings.
I imagine that will continue to be the case between these two areas as the others have less land available for residential. The warehouse district will see an uptick with The Dillon so perhaps this area could have a surge soon.
8,200 residents is still very small compared to the city’s 440,000. We’re talking about 2% of the population. However, in addition to residential projects, the commercial, convention, government, and everything else taking place makes a big impact on the health of our city from a tax point of view.
The revenue generated from downtown projects generate a lot more than those taking place in the suburbs. A dense development needs less stuff from the city; less pipes, less connections, less roads. We therefore get a lot back from it so I like showing this graphic below that a healthy downtown means that the whole city benefits.