Embedded above (or here on YouTube) is the video of Raleigh Police Chief Estella Patterson presenting some data and observations about crime in Glenwood South for this year. The numbers are up and it’s been leading to concerns from nearby residents and the council overall.
The News and Observer started things off nicely:
The chief showed crime data comparing the 10 months leading up the pandemic and the last 10 months. Since June 2021, there have been 76 weapon violations, including 64 concealed weapon violations. That compares to 16 violations from June 2019 to March 2020.
There also is a sizable increase in traffic-related violations, but Patterson said the department increased enforcement and the number of traffic stops during that time.
Raleigh police chief makes recommendations to address rising crime in Glenwood South via newsobserver.com
The N&O article also has a graphic showing year-to-date (Jan 1 to Mar 20) figures from 2019 to 2022. Drug-related incidents are up as well as larceny and assaults. As expected, there is a dip in 2020 and 2021 due to pandemic restrictions and lockdowns.
Looking at these figures, I just had to see more as data from 2019 to 2022, with a pandemic right in the middle, may not tell us the whole story.
The Data
I went to the dataset, showing datapoints from June 2014, and built up my own app with charts and tables. You can dive into that here.
The site I built does the following:
- Shows the Glenwood South map and only takes in incidents that occur inside the boundary area
- Year-to-date figures for top crime categories from 2015 to 2022
- Displays Total Yearly Incidents by top crime categories
- Displays Total Yearly Incidents for all crime categories
- Pulls data nightly and updates the year-to-date figures
What I’m calling “Top Crime Categories” are the types of crime, as identified by the data, that when summed up, represent about 2/3 of the total incidents. The remainder incident types seem to be so few in occurrence that it’s hard to know if a trend is taking place. I’ll just remove those from the “Top” charts for now.
Top Crime Categories include:
- Assault
- Larceny
- Drugs
- Weapons Violation
- Vandalism
- “All Other Offenses”
- Drug Violations
I guess I could have added up Drugs and Drug Violations but I kept the data “pure” for now. Also, I’m not sure what “All Other Offenses” means exactly so this one might qualify to be ignored. Take it for what it’s worth.
Last thing to point out, I start with 2015 as the dataset starts in the middle of 2014 so a partial year isn’t helping that much. 2015 is great as we get five full years before the pandemic lockdowns took place starting in March 2020.
Yearly Totals
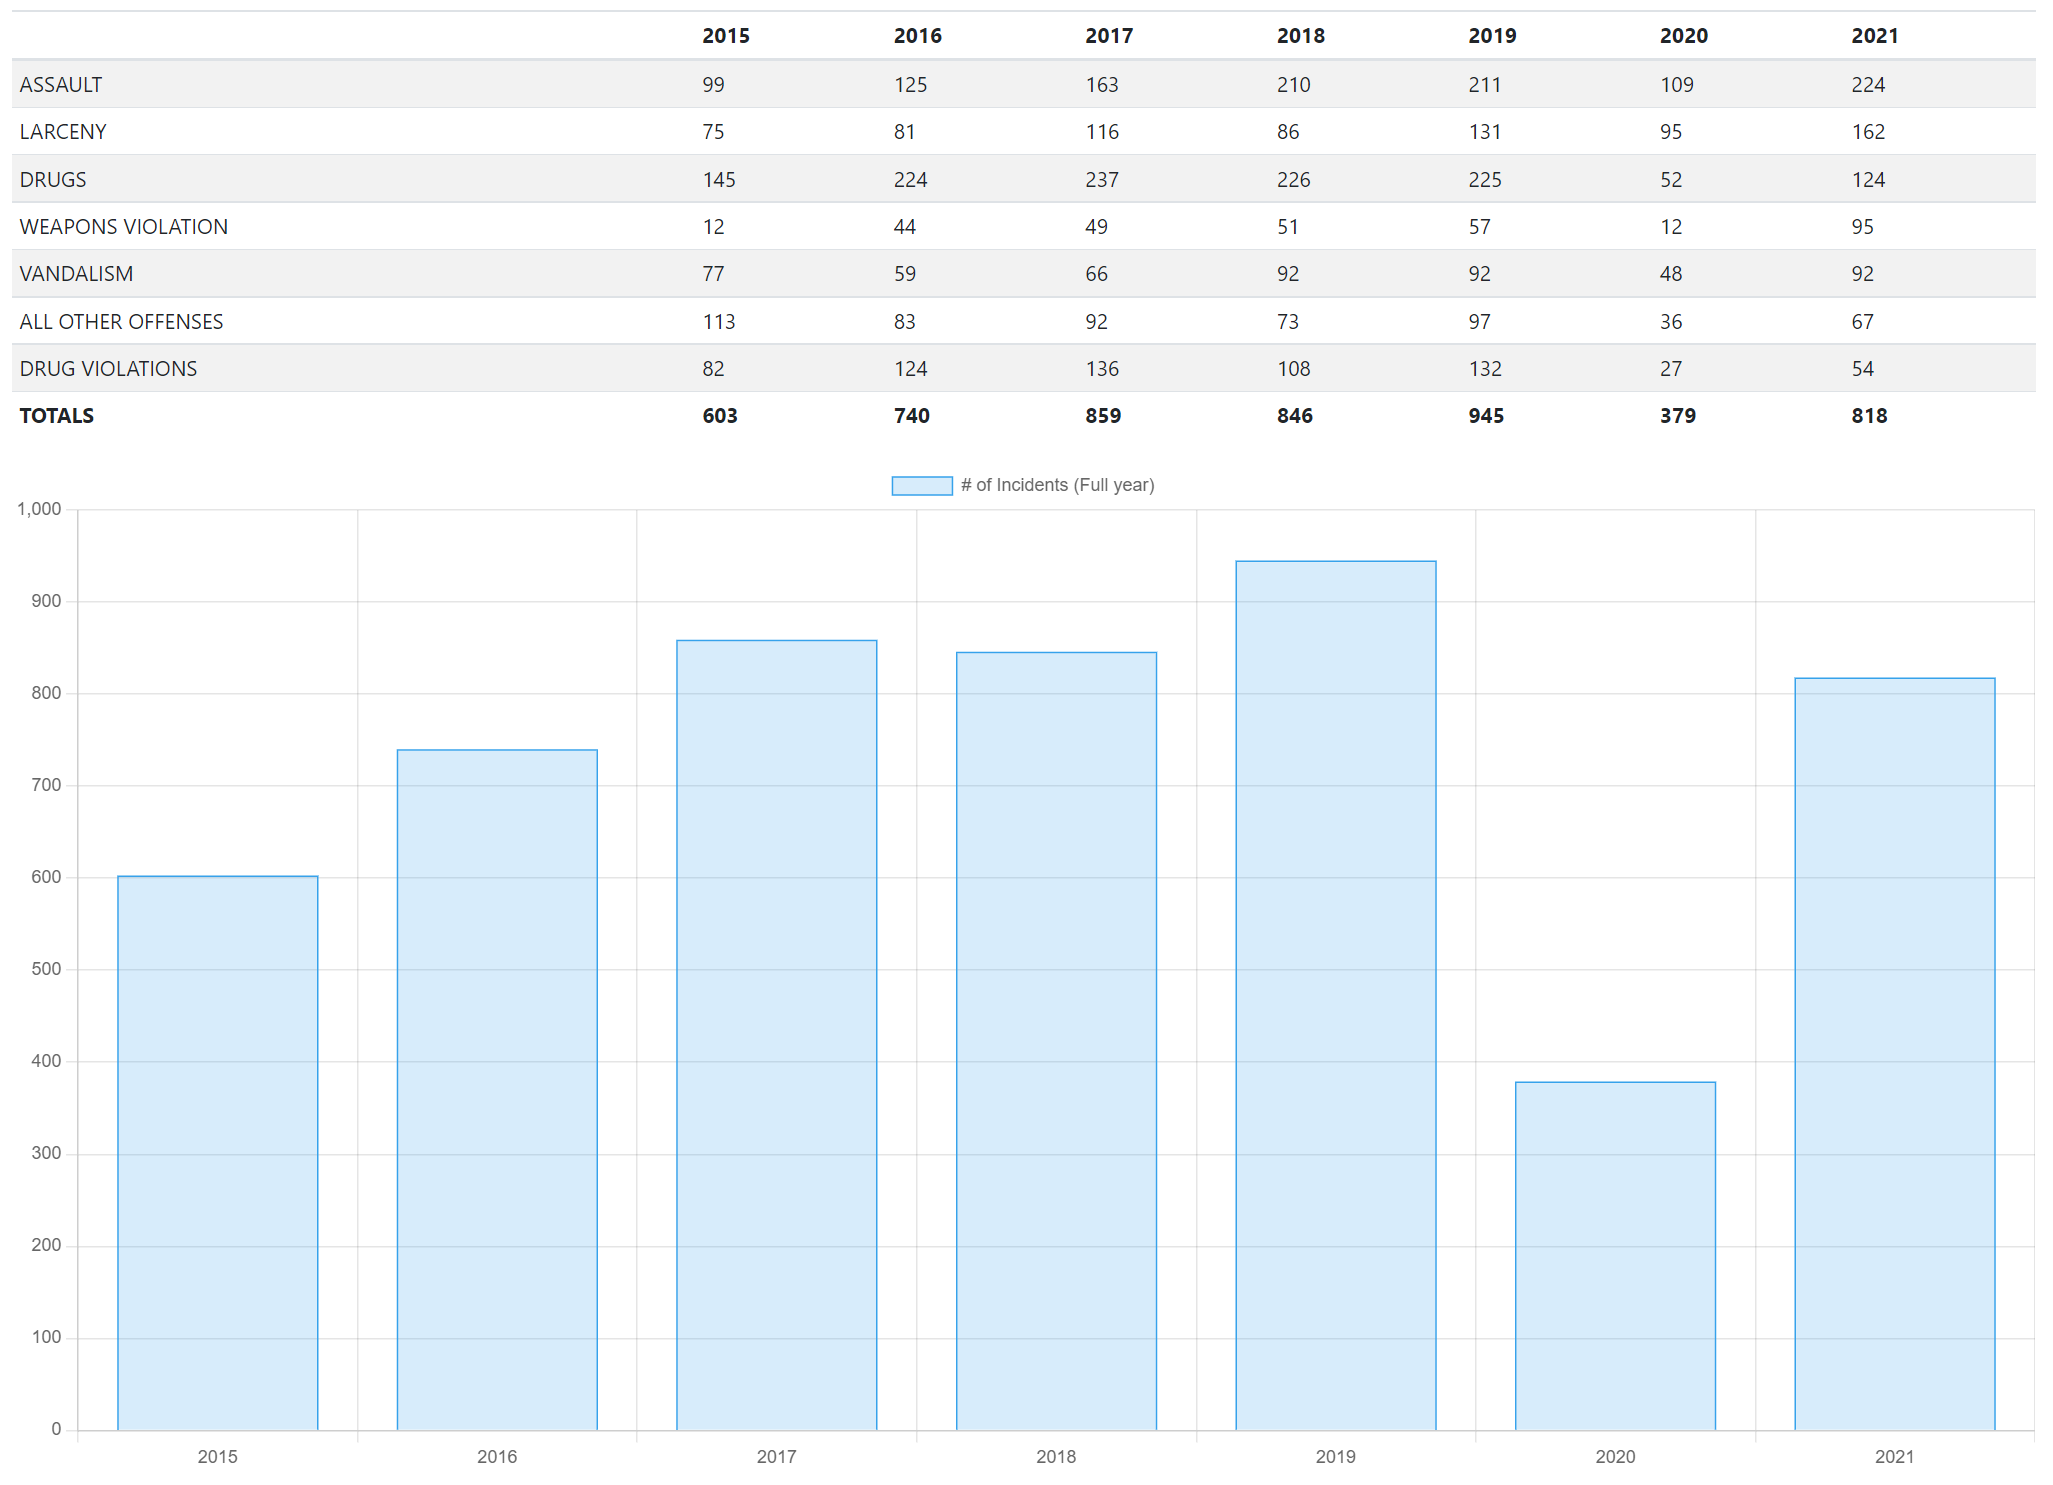
Indeed, when we look at just the top crime categories as well as all crime categories, the number of incidents has been increasing since 2015. It actually went down in 2018, not by much, but continued on its trajectory in 2019.
Again, the big drop in 2020 is most likely due to the pandemic lockdowns and we can see the recovery in 2021. If we remove 2020, some items to note:
- number of assault, larceny, and weapons incidents have increased
- number of vandalism and drugs are more of less the same
- “all other offenses” has gone down
I’m not sure we can figure out what’s going on but there are some things to note. Consider that since 2015, more development has taken place. The number of residents have increased and the number of restaurants and bars opened has increased.
A good figure to share is from the 2021 State of Downtown Raleigh report which I’ll add here.
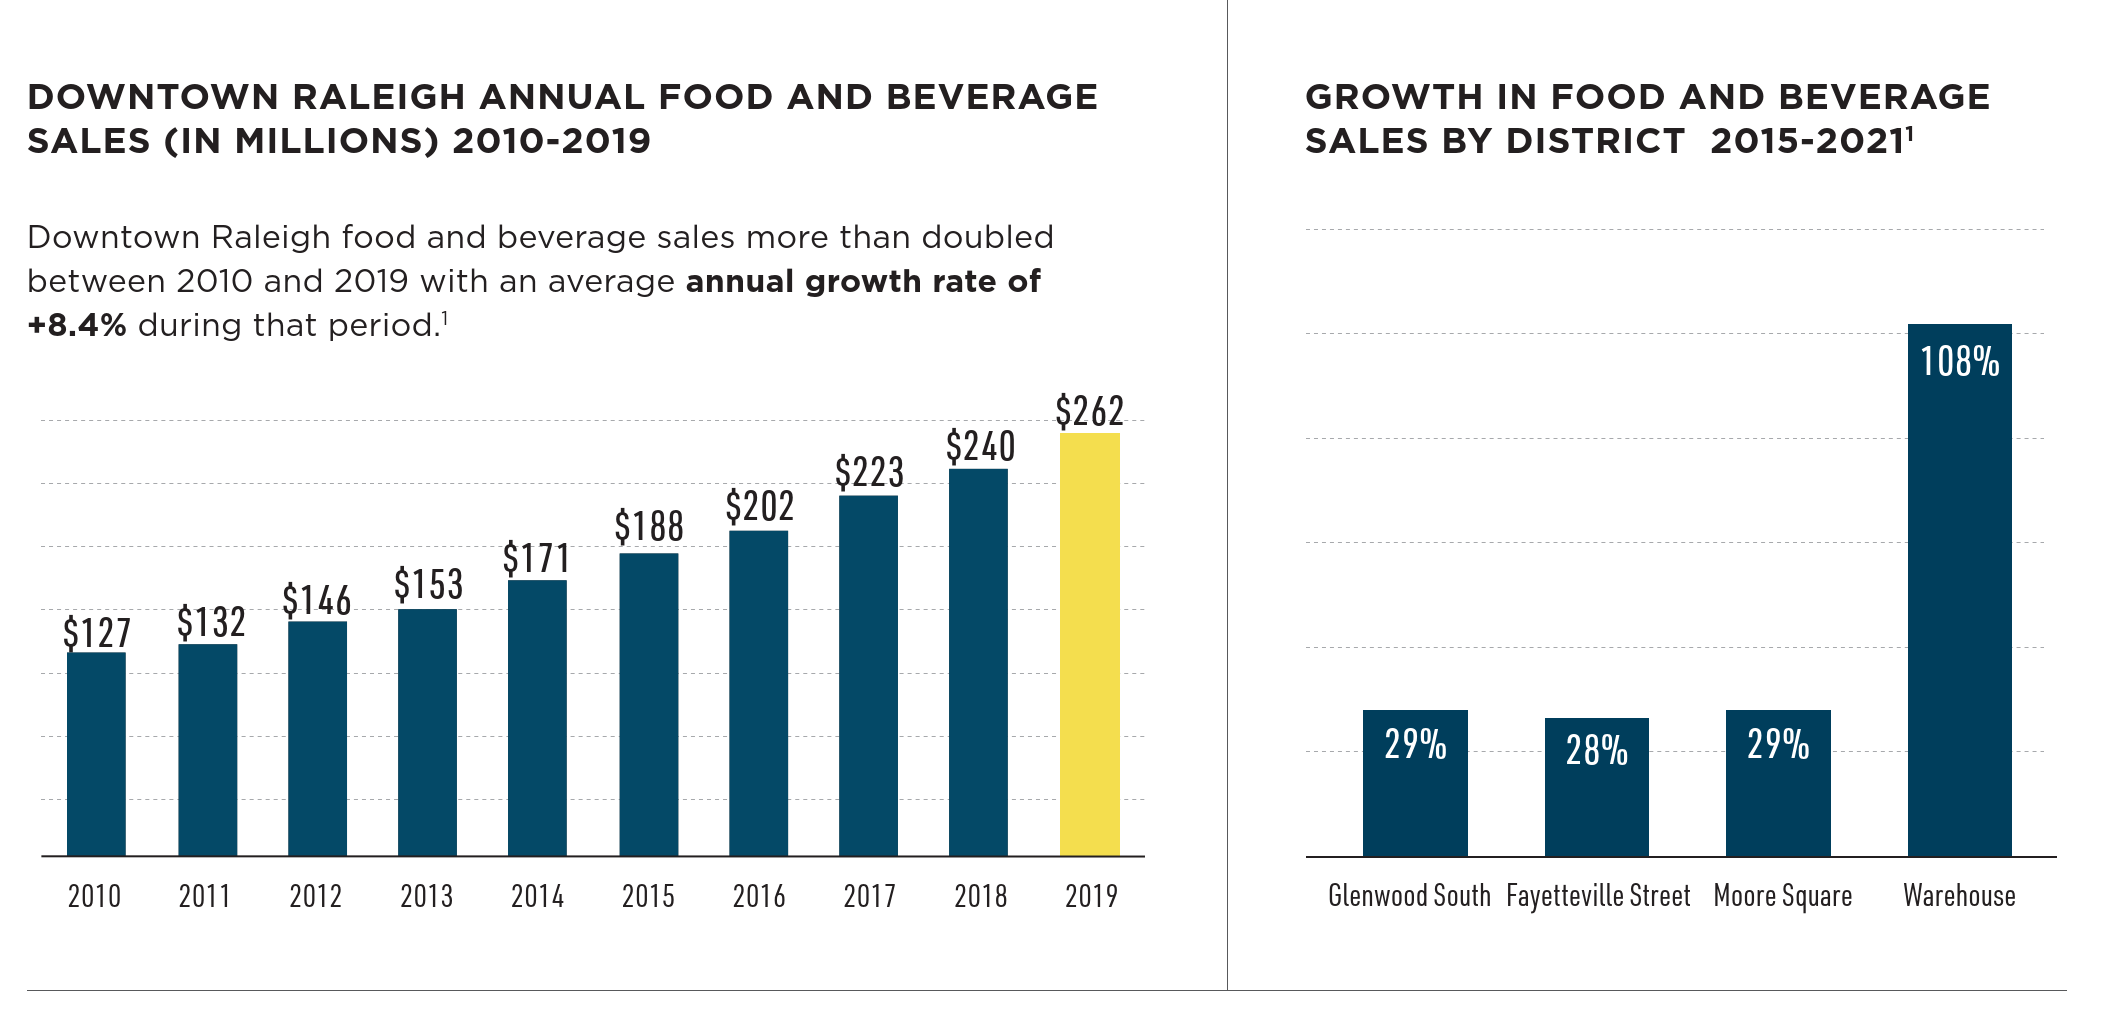
Does increased food and beverage sales lead to more crime? Not necessarily but if we think for a moment that there are more people in Glenwood South, leading to more F&B sales, we could argue that more people in a district could lead to more crime. The above figures show a 29% growth in F&B sales from 2015 to 2021 for Glenwood South. In addition:
- From 2015 to 2021, Glenwood South had an 18% increase in crime incidents overall
- From 2015 to 2021, Glenwood South had a 36% increase in TOP crime incidents
The real comparison, saved for a later post most likely, is to compare this activity with other districts.
Year-to-Date Figures
The app tracking the data runs nightly so if you want to check back later this year to see how we’re doing, you can do just that. Here’s the snapshot up until April 12, 2022.
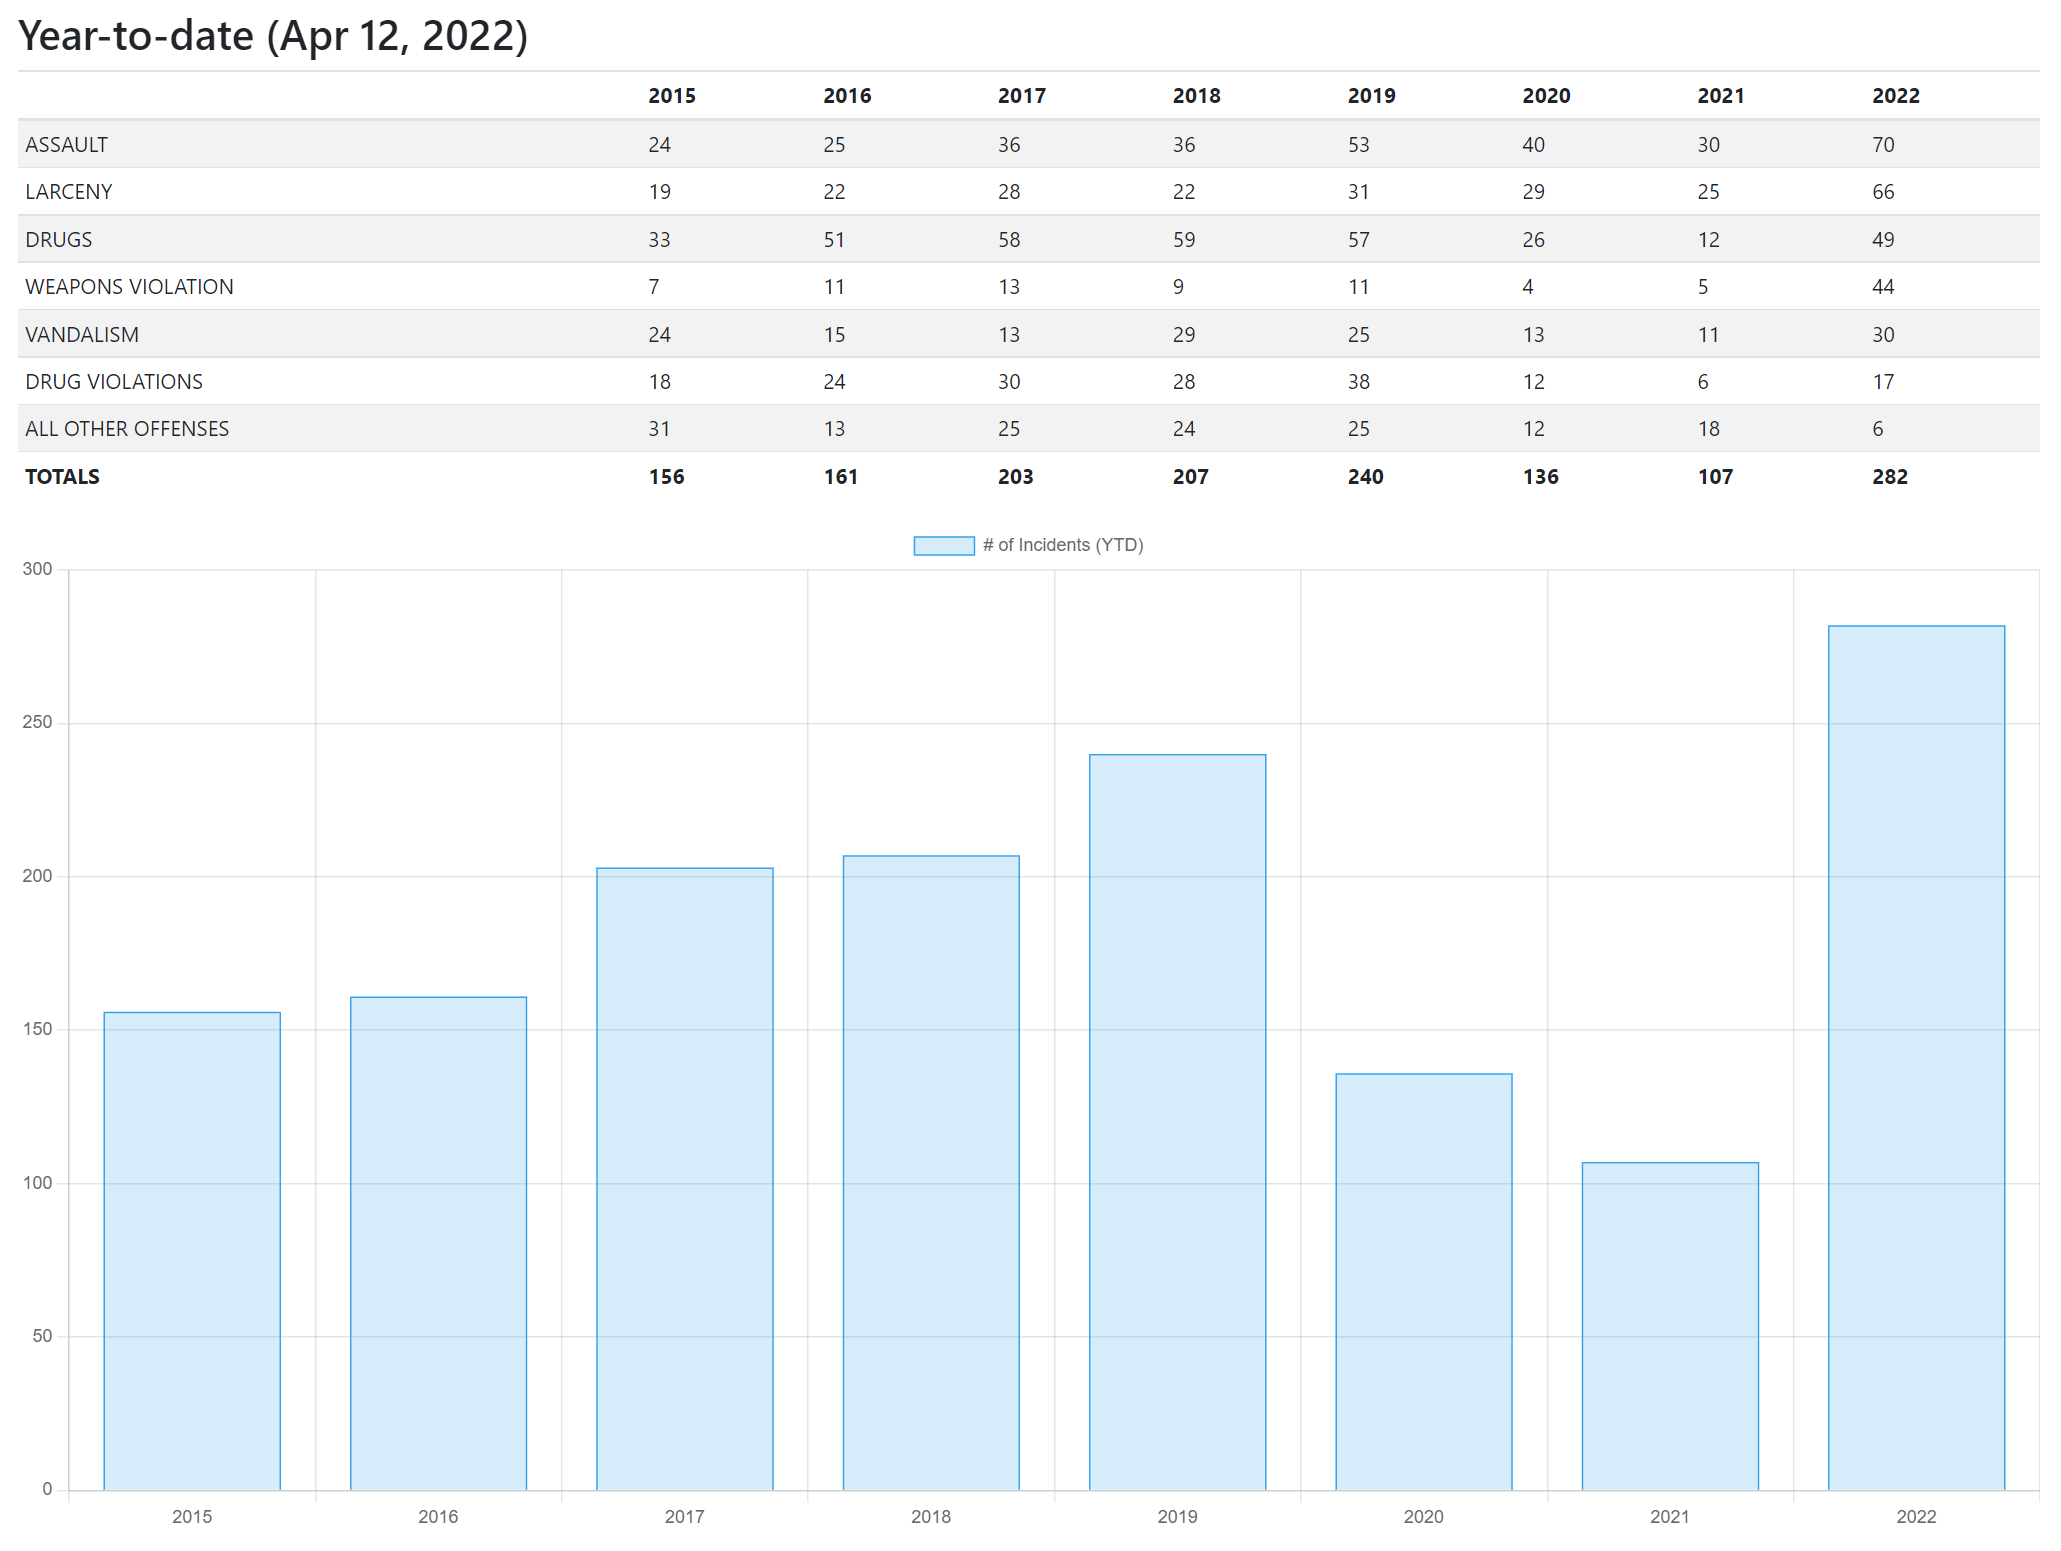
Year-to-date figures are pretty much in-line with everything stated above so I’ll leave it right there.
Final Thoughts
The police chief had some suggestions to try and curb this increase in incidents including adding metal detectors at bars as well as changing Glenwood Avenue to a one-way street to keep car traffic flowing more smoothly. A catastrophic incident is not something anyone wants so it’s a good idea to keep an eye on the trends.
We’ll see if any changes come from the city to try and smooth down these numbers. What I really want to see is a comparison of this activity and the number of incidents to other areas to get a sense of context. That’s a post for later this year perhaps.
If you’d like to discuss more about Crime in downtown Raleigh, we have a thread for this on the Community.
Comments
Comments are disabled here. That's because we're all hanging out on the DTRaleigh Community, an online forum for passionate fans of the Oak City.