Lately, I’ve been less active on the front-side of the Raleigh House of Connoisseur but have been heads down working with creating a new map. I don’t think I’m finished and honestly, haven’t even started any type of analysis, but I wanted to put an update out there and share something with readers.
TLDR? Just go here to the map.
The Background
I was inspired when I stumbled on this map of Paris, introduced by the tweet shown below. Technically, it was something I wanted to see if I could build for Raleigh but also, it would be interesting to see how the buildings of today have held up. Are we seeing “mass teardowns” as some people think? What other questions might we begin to answer?
I then found the “ingredients” on the city’s open data websites around Raleigh parcel data and using the “year built” field, I starting analyzing over 130,000 pieces of data.
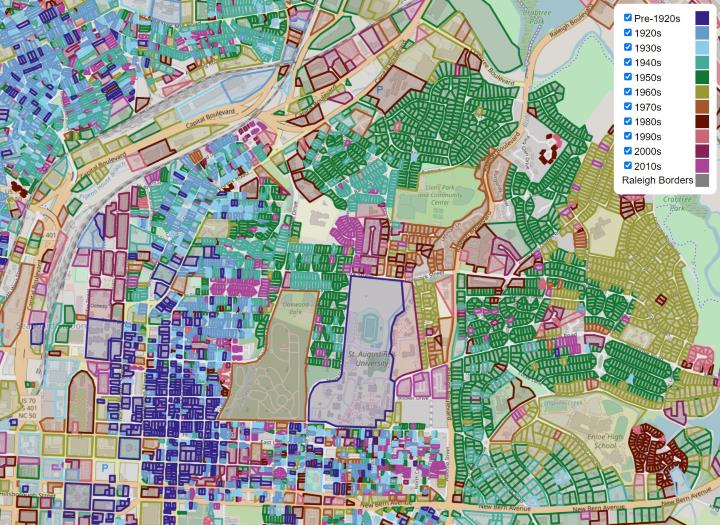
The Map
The map I put together shows Raleigh’s existing stock of buildings as of May 2022. It’s important to note that this is a snapshot in time, not buildings constructed over time. For example, if a home built in the 1950s was torn down for a new construction home in 2015, the parcel would show in the 2010s decade, not the 1950s.
https://develop.dtraleigh.com/buildings/
Please note that the property shapes have been optimized so that the map is somewhat usable. Don’t take them literally.
I grouped properties by decades with an additional “Pre-1920s” category. This was driven mostly by number of buildings as the counts before 1920 is pretty low. Here’s a bar chart.

That it?
Probably not. I’m releasing it into the wild and see how it sits for awhile. We are discussing it on the Community on this thread so if you have any questions or thoughts, please join us.
I’m hoping to continue tinkering with this map and see what we can extract from it. Questions I have could be:
- Are there neighborhoods that have been completely turned over?
- Are certain neighborhoods less susceptible to teardowns than others?
- Where do you see a mix of buildings being produced at a constant rate?
- Why is the building count in the 2010s so much lower?
- How might annexations and border expansions played a role over time?
- How might protectionist overlays, like NCODs and historic overlays, played a role?
Expect follow up posts in the future.
Comments
Comments are disabled here. That's because we're all hanging out on the DTRaleigh Community, an online forum for passionate fans of the Oak City.