OK. It doesn’t say that exactly but after seeing the tweet below, I couldn’t help but take a second look at the Downtown Raleigh Alliance 2023 Q1 report and count up those residential numbers.
Continue reading →OK. It doesn’t say that exactly but after seeing the tweet below, I couldn’t help but take a second look at the Downtown Raleigh Alliance 2023 Q1 report and count up those residential numbers.
Continue reading →I’m watching my way through this presentation from Bill King, President and CEO of the Downtown Raleigh Alliance, on the state of downtown, challenges his organization has seen over the past year, and how downtown is coming back as Raleigh gets vaccinated against COVID. My main takeaway is that we are definitely ramping back to pre-pandemic levels as far as food and beverage sales go and pedestrian traffic is ticking up. This is great to see!
Glenwood South is leading the way with weekends being pretty busy. Fayetteville Street is lagging behind as the office crowd has still not quite returned, with around only a quarter of employees being in their offices compared to reports before the pandemic. Surveys and discussions with office managers suggest that office workers will be coming back slowly throughout the Summer and into the Fall. That should help the weekday hours kind of fill in.
It seems very positive and I encourage everyone to listen in.
Every Spring, the Downtown Raleigh Alliance releases their “State of” report and it’s full of data goodness about our city’s core. If you want to dive into it, go here.
Having seen a few of these, there are some stats that I go for each year and I wanted to put them down here for Part 1.
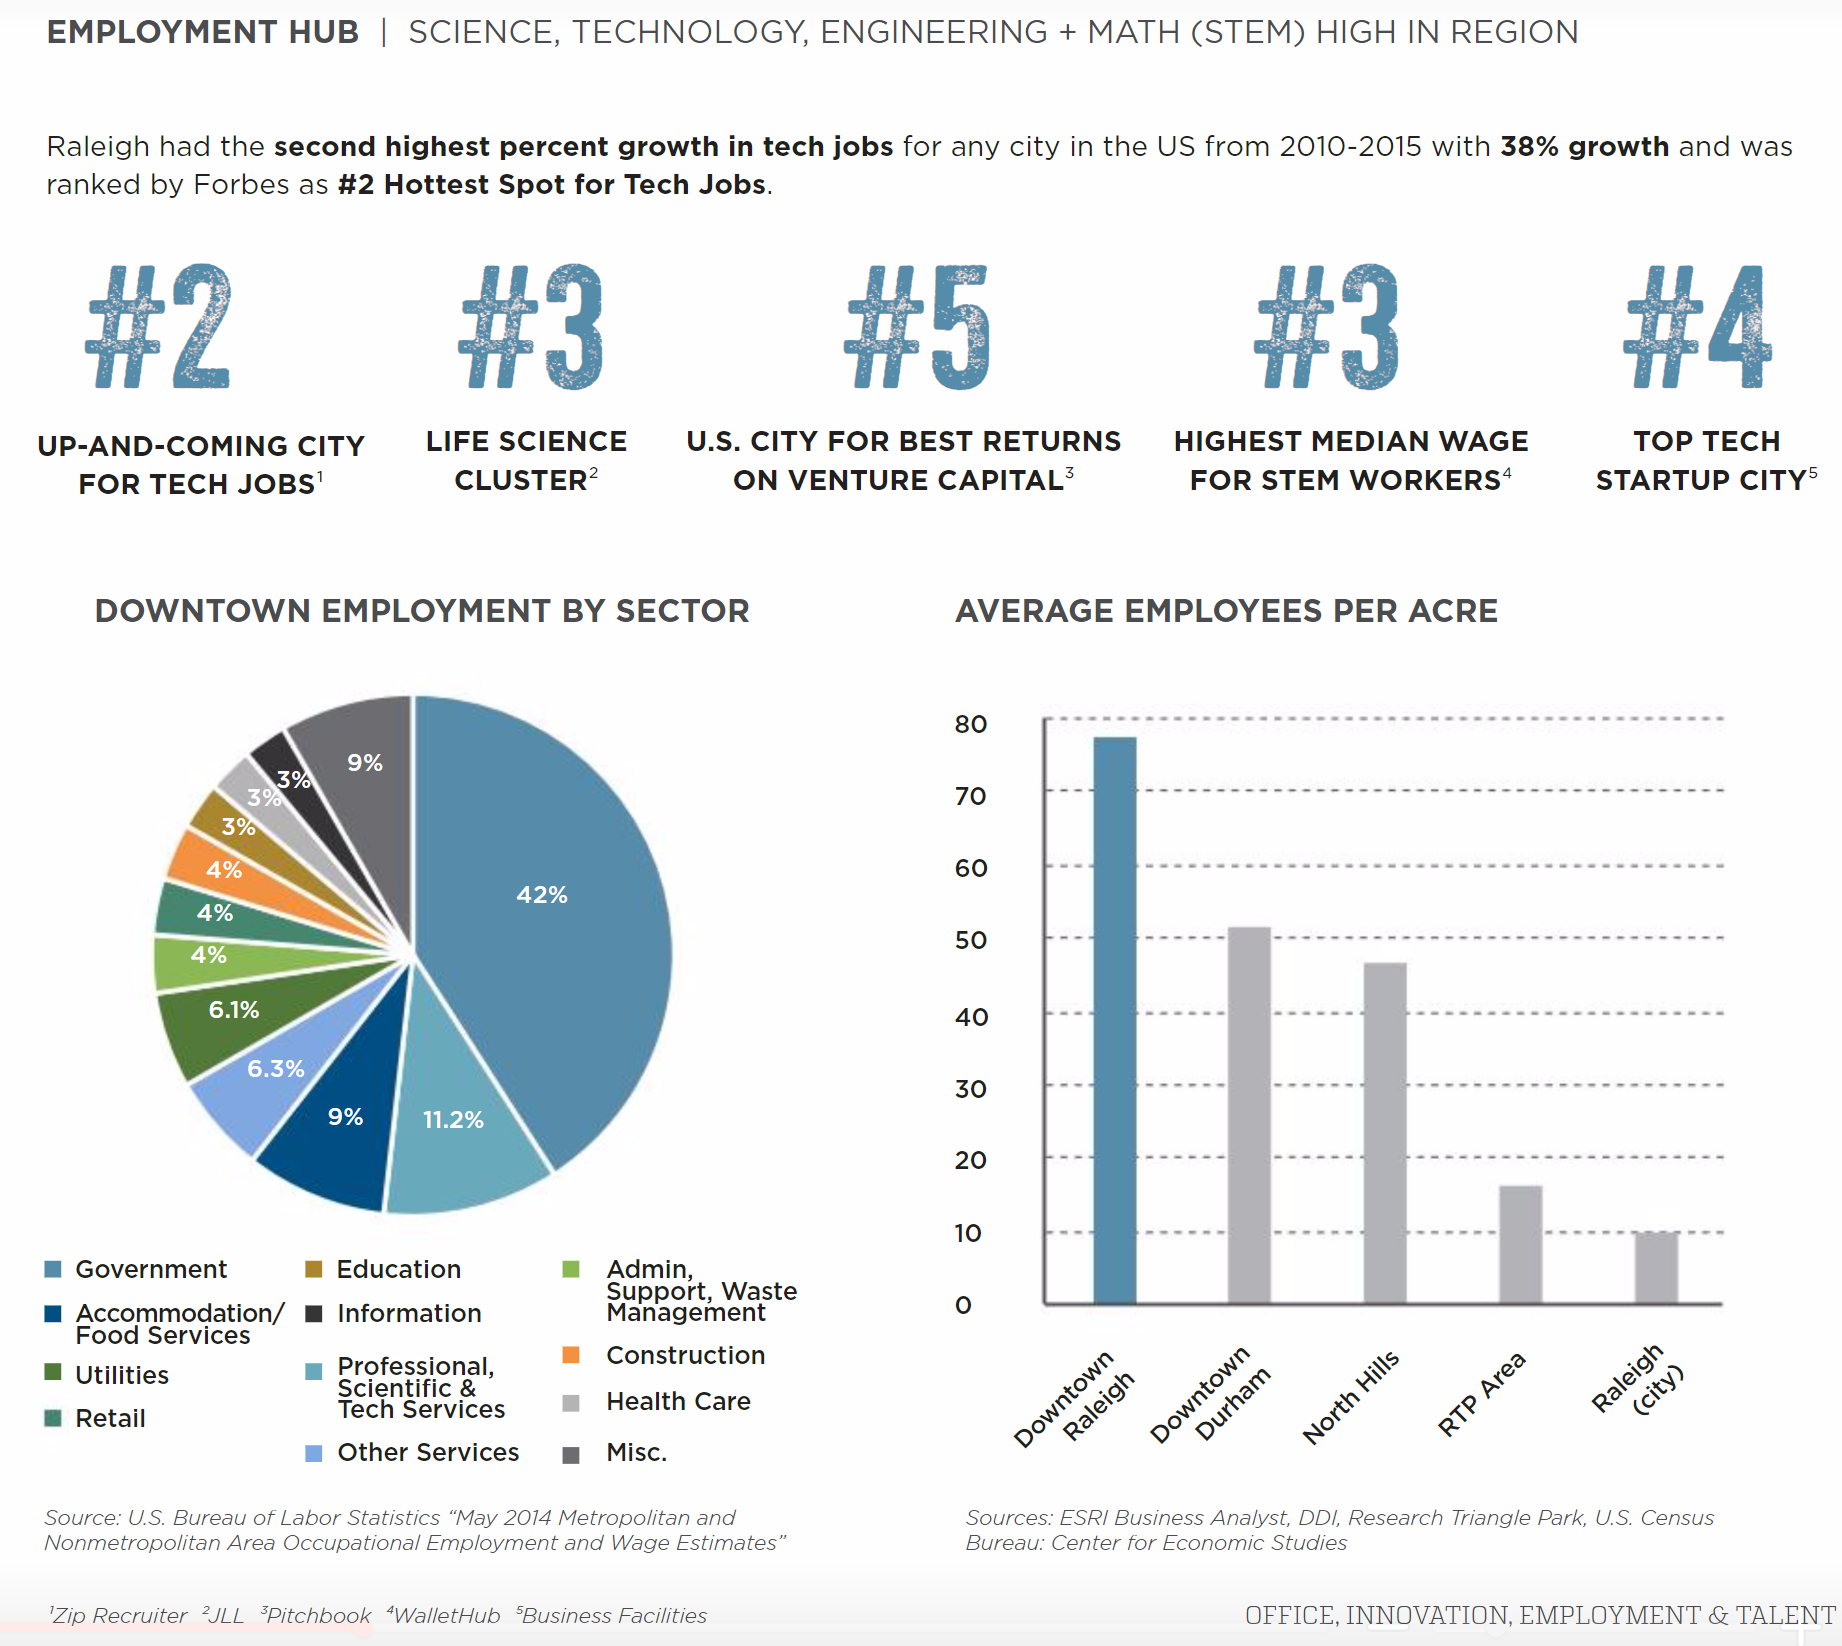
Employment
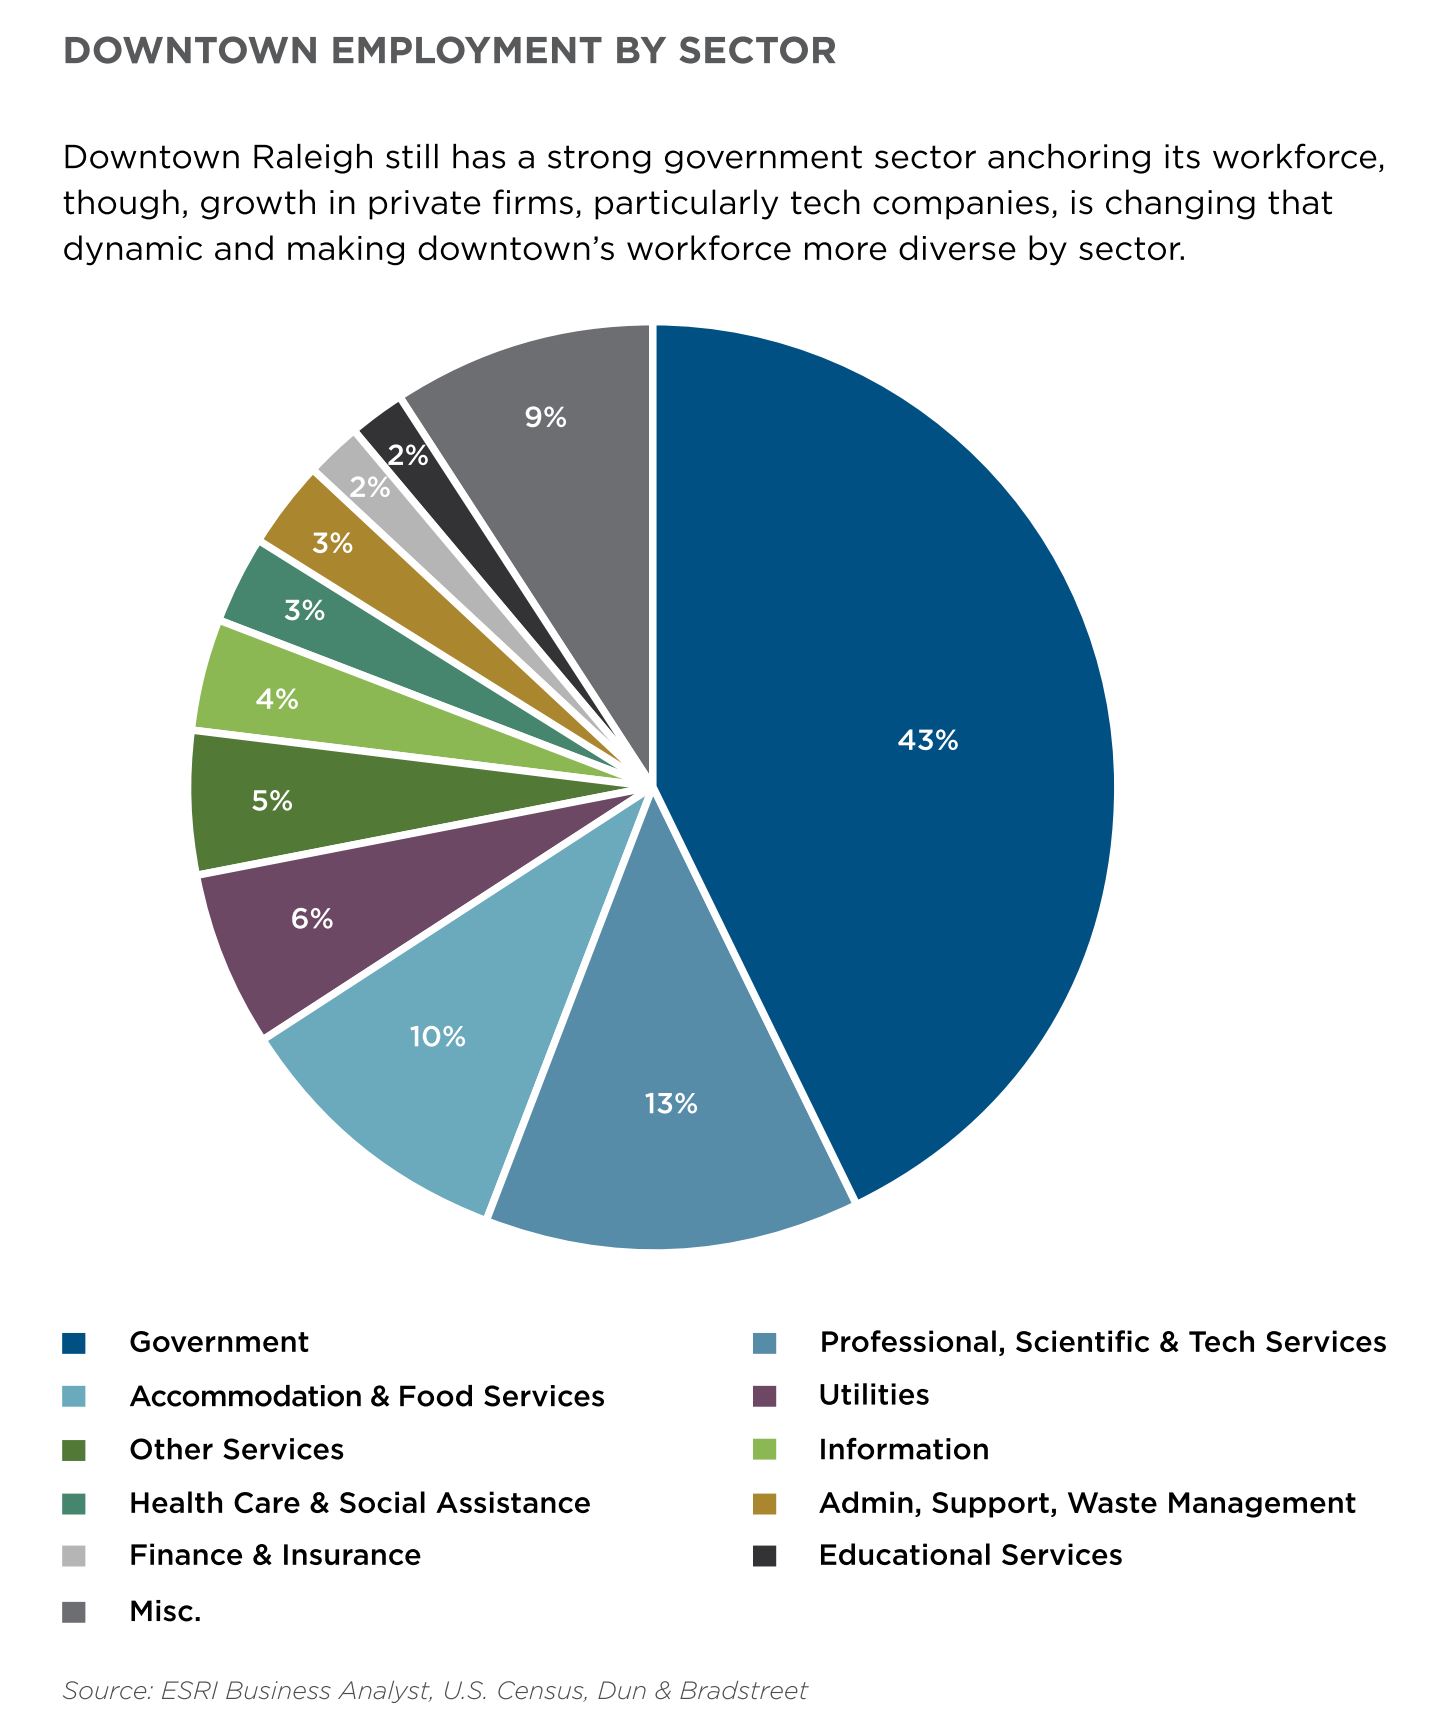
Government everywhere.
We’re still a government town and the figure below shows the latest breakdown of employment by sector.
Downtown Raleigh has the densest office market in the Triangle. The count of urban workers is now at 47,000 and is projected to be at 56,500 by 2030.
Compared to last year:
The rest more or less went down a percentage point.
Population
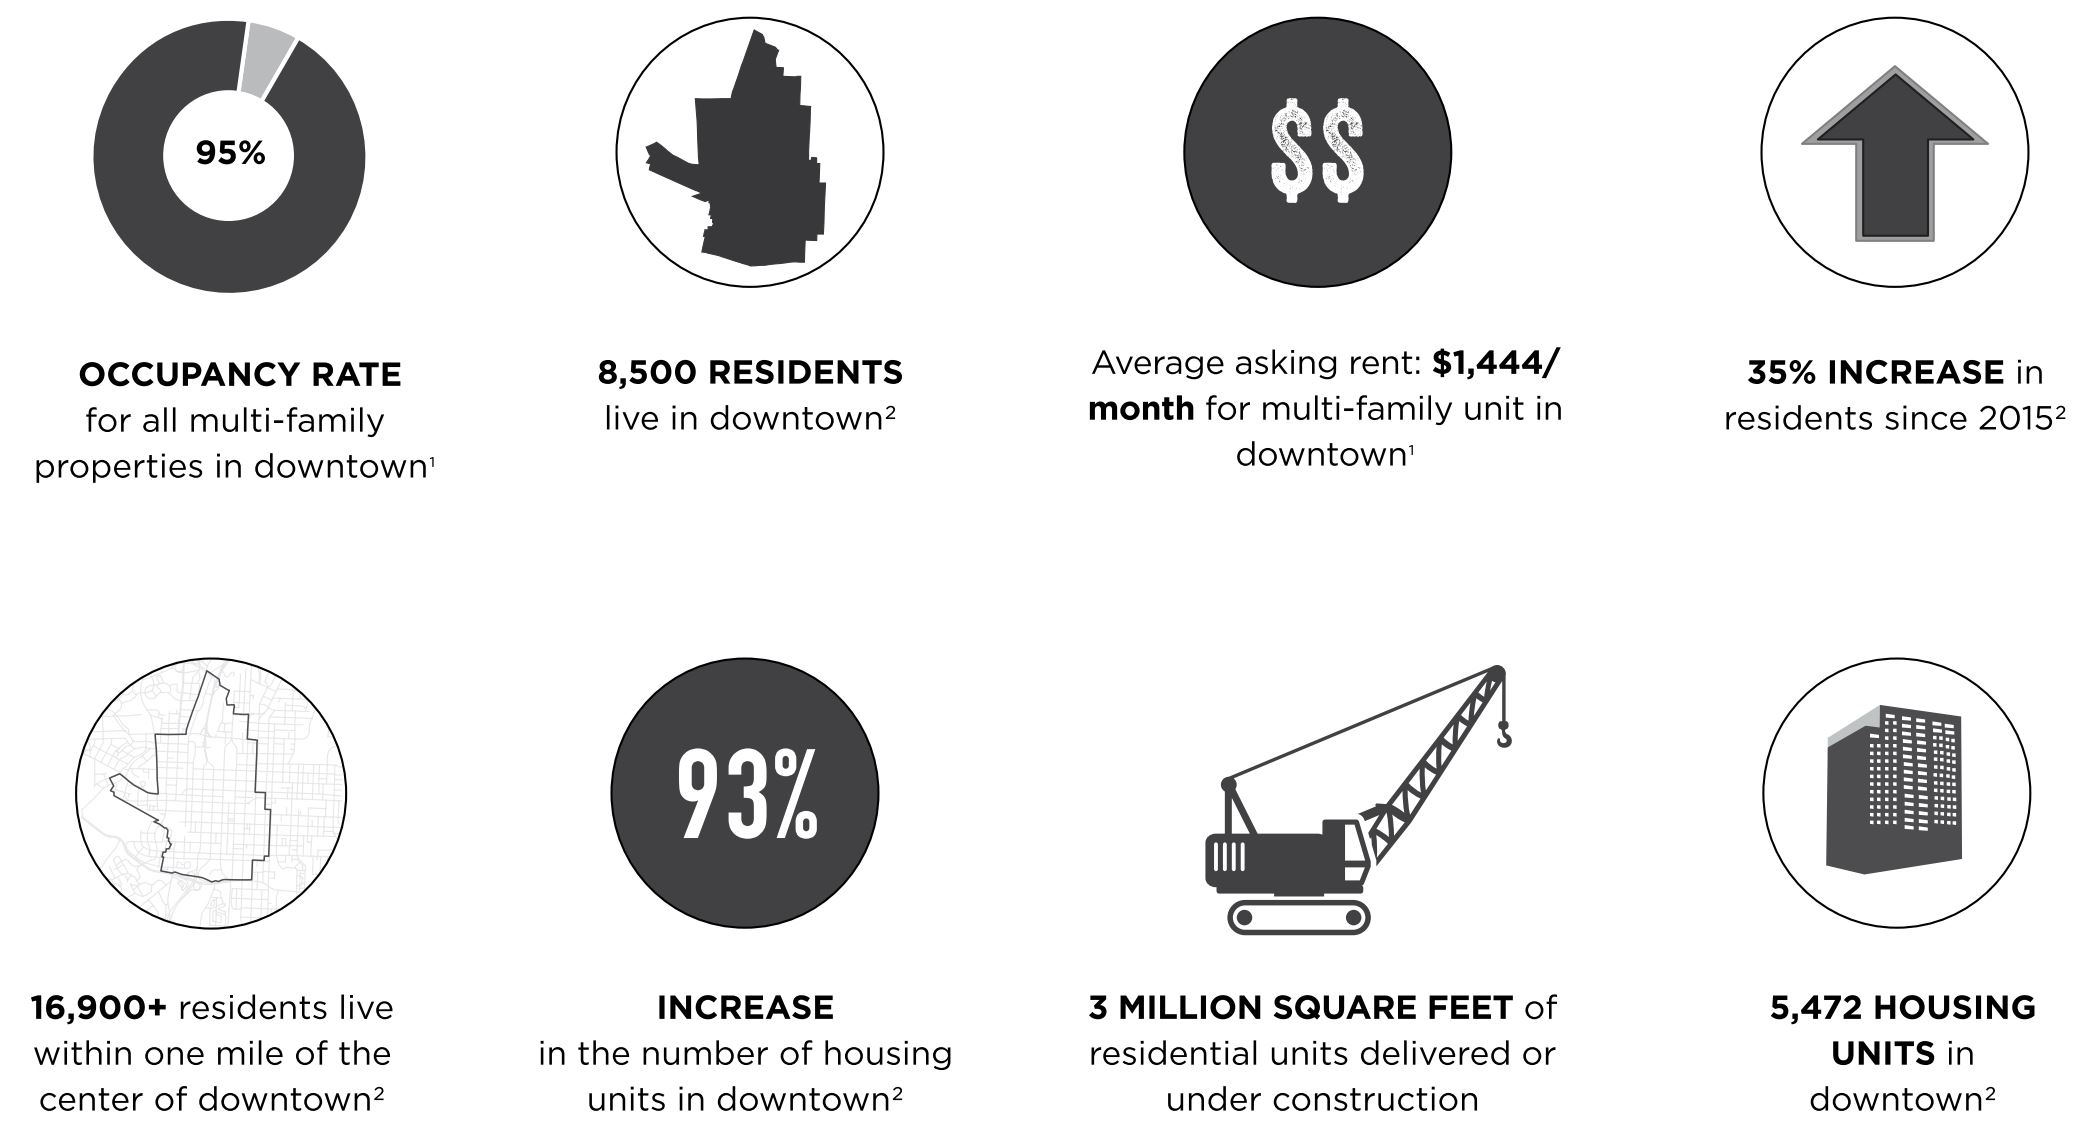
8,500.
There are now 8,500 residents living in downtown Raleigh and we’re projected to hit 10,000 by 2022. The occupancy rate is also at 95%, up one over last year so we’re ready to absorb more units.
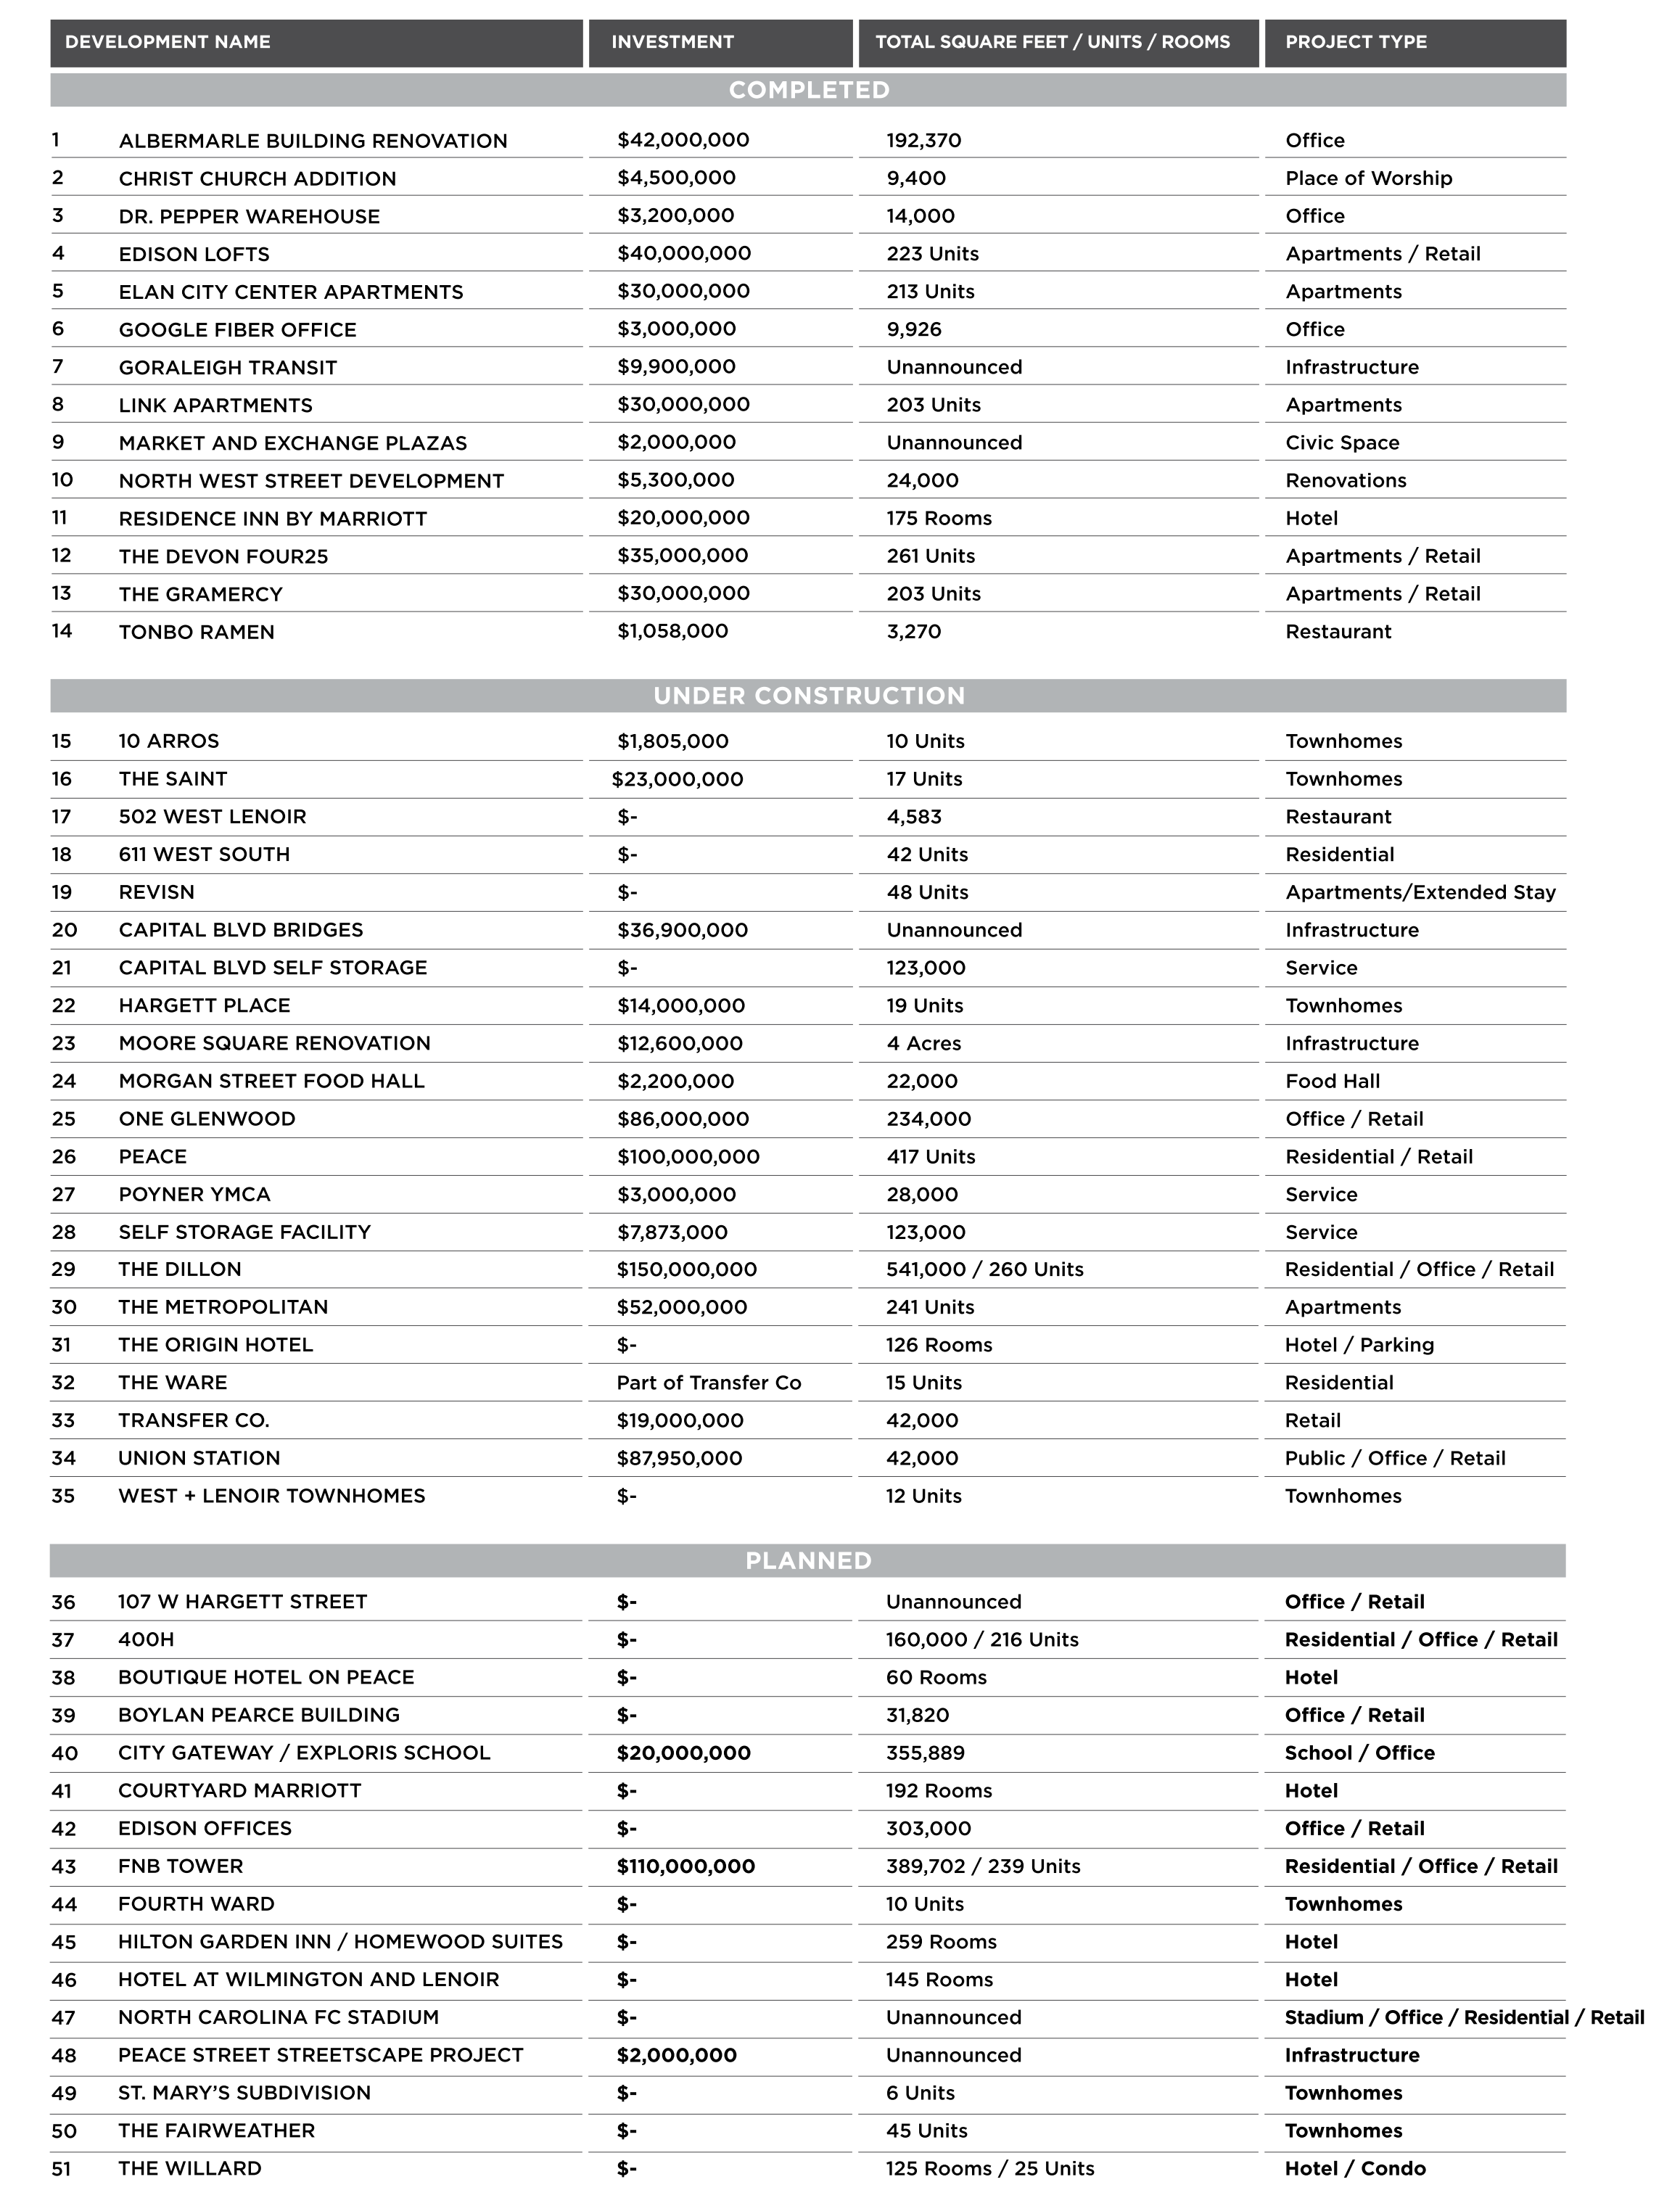
List of Projects
And finally, here’s the big list of developments from the report showing completed, under construction, and planned projects in downtown Raleigh.
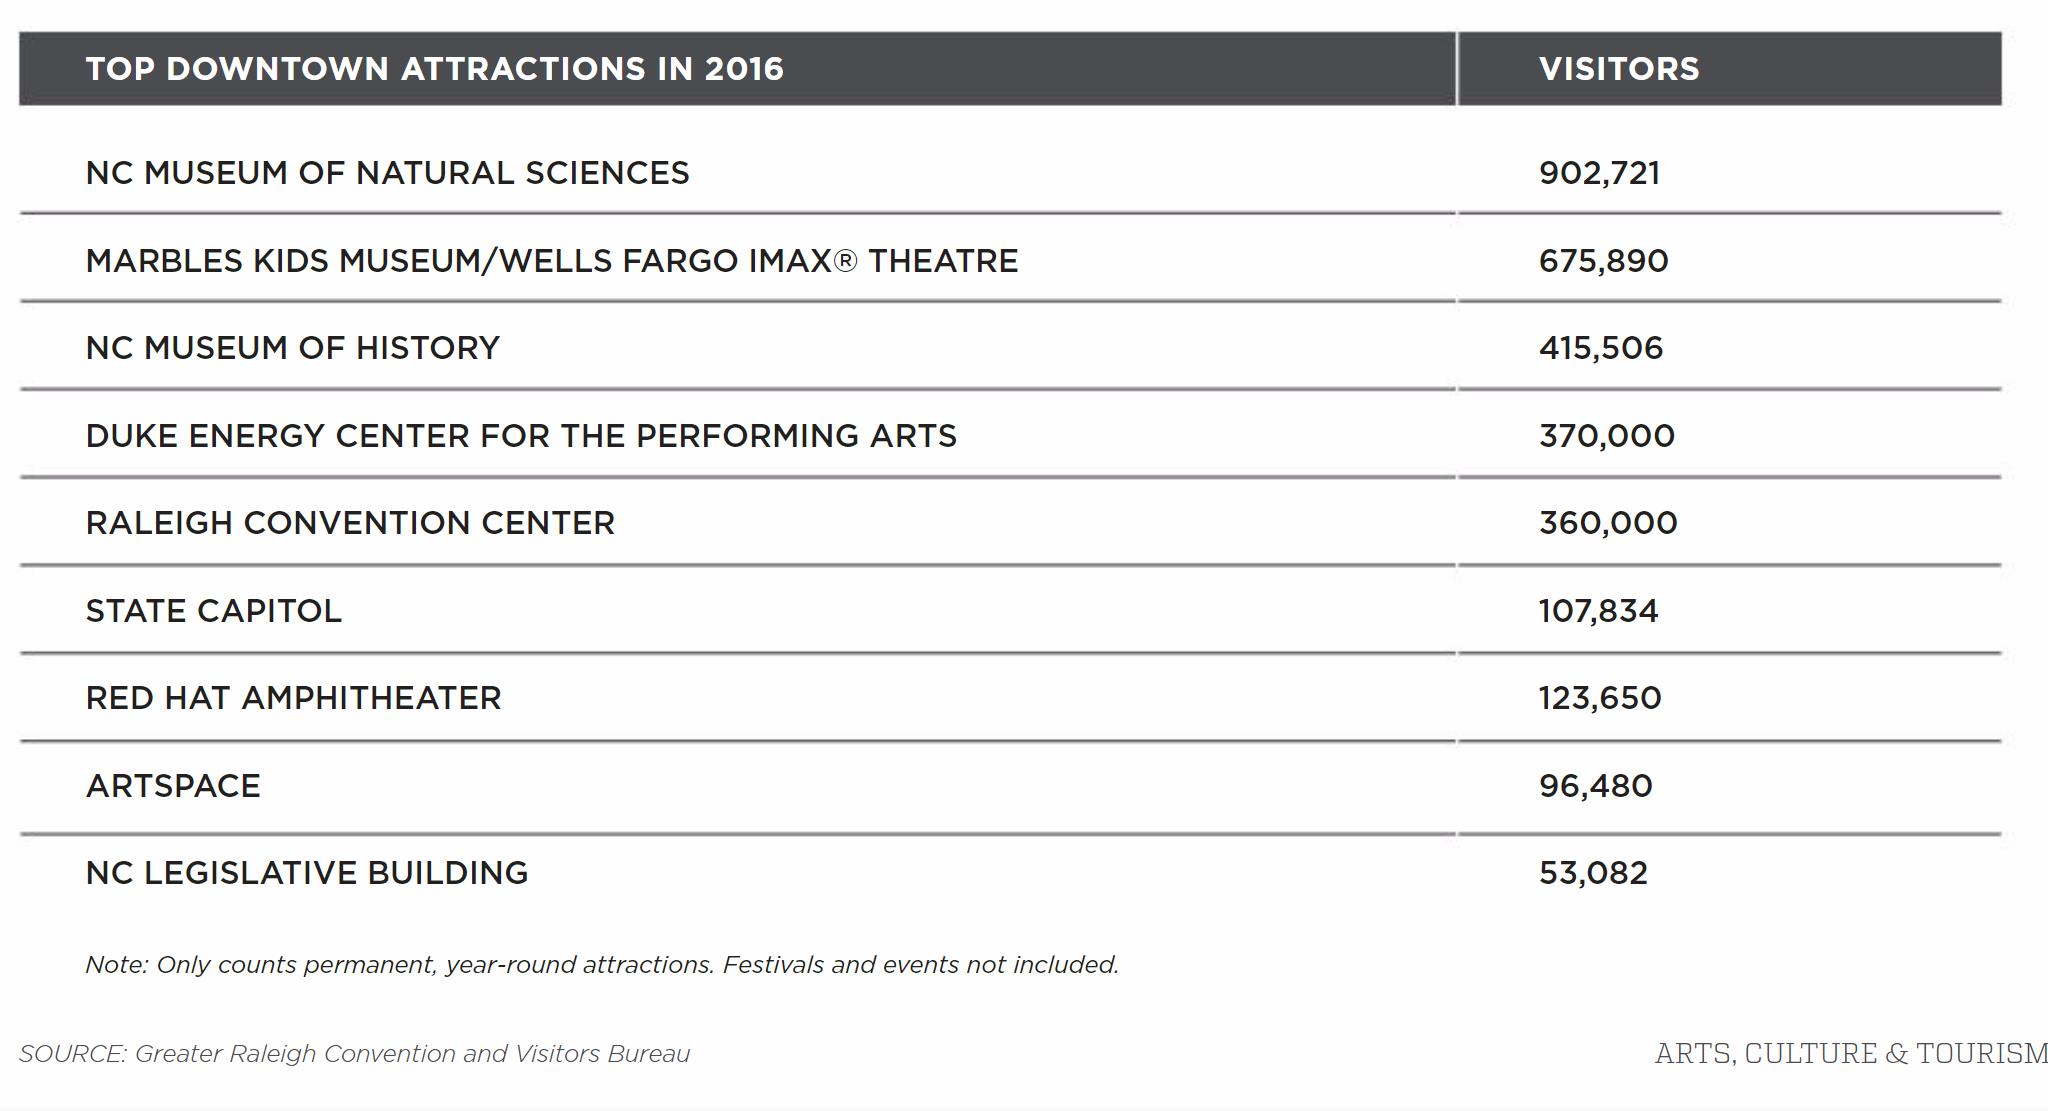
Our final “visit” to the 2017 State of Downtown Raleigh report focuses on visitors and retail. Jump back to this tag to review some of the other things discussed from this year’s report.
The above figure shows the top attractions in downtown Raleigh. For years, the NC Museum of Natural Sciences (NCMNS) has been at the top of the pack. It doesn’t hurt to have a state-wide draw, putting it in the top visited sites in the entire state.
Tourism in general depends on how you look at things. Since Fayetteville Street opened, 2007, the numbers have gone up by 36%. There seems to be a peak in 2012 with things leveling off more recently.
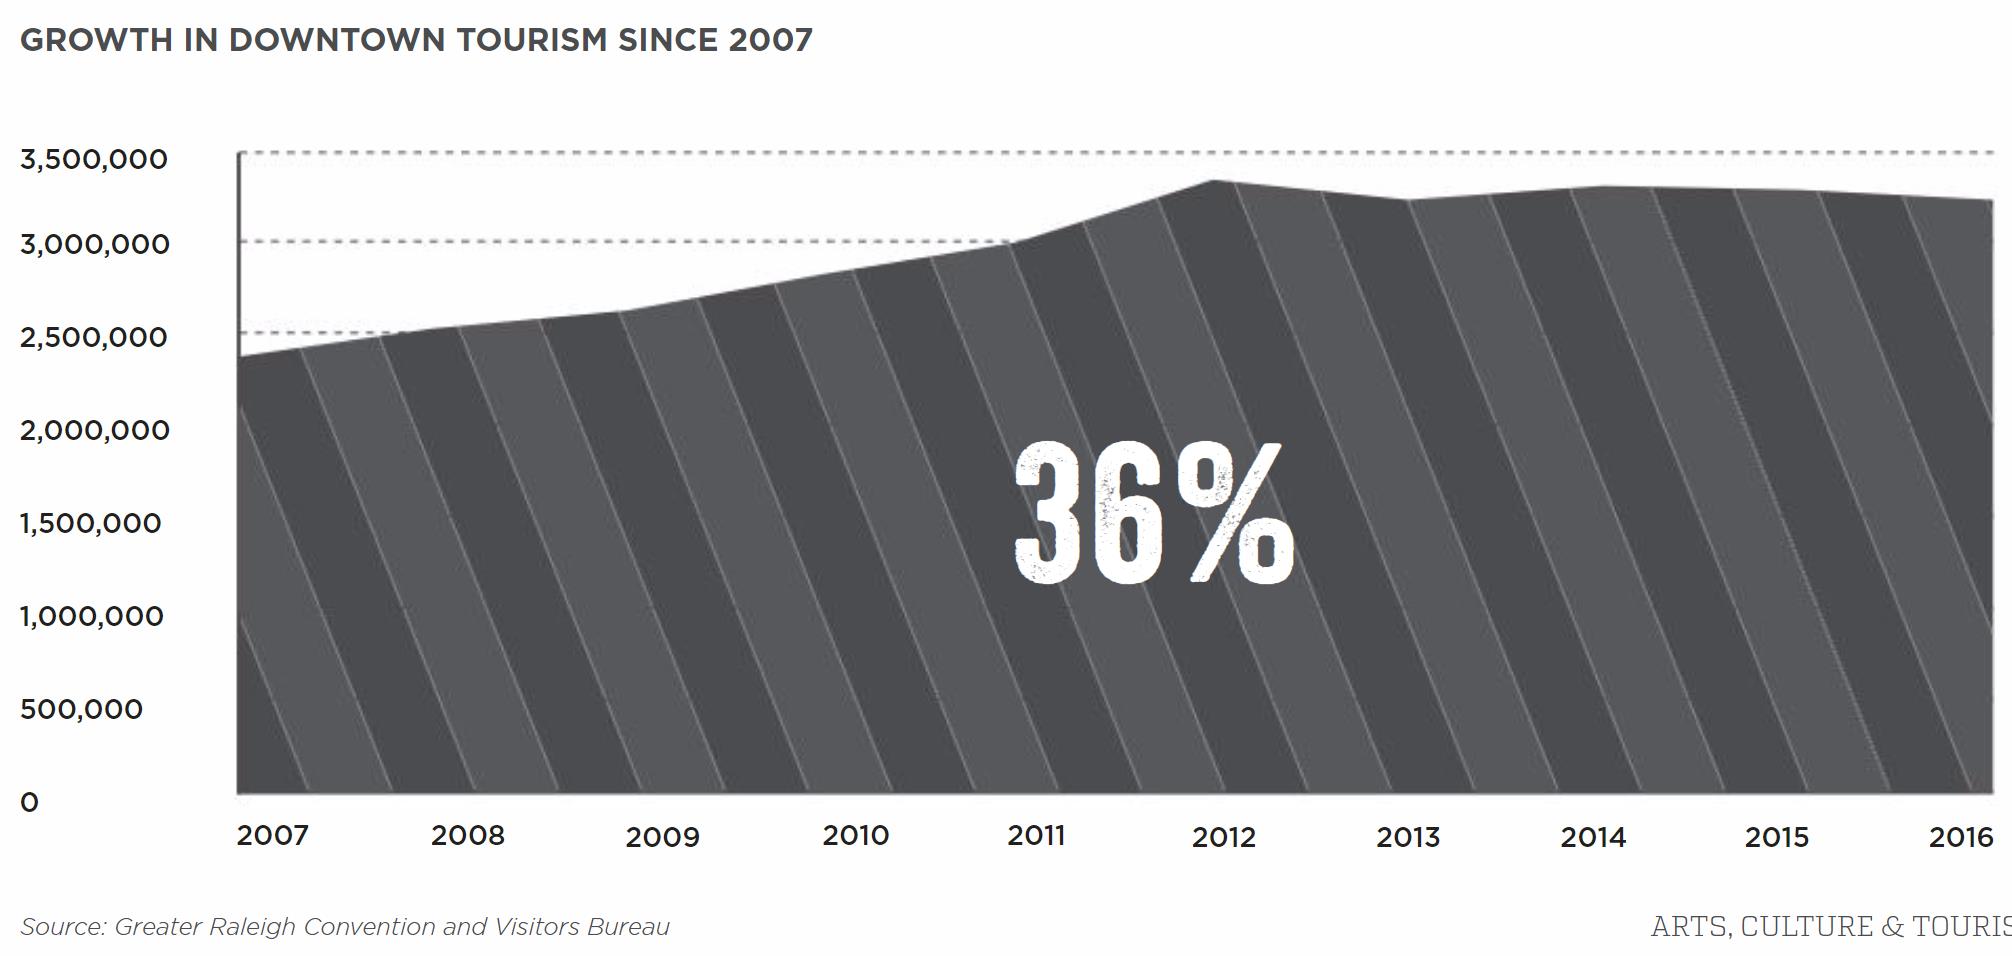
With the Nature Research Center opening as part of the NCMNS in 2012, that could explain the bump in that year. It may have “cooled off” after opening leading to the decline. In recent years, there hasn’t been any major openings or attractions to really ramp up visitors, ones that count the crowds anyway.
With events growing more and more, and numbers not reported in this figure, that, as well as other factors, may be at play here.
On the retail front, the report states a 28% increase in shops since 2010, most being independently owned.
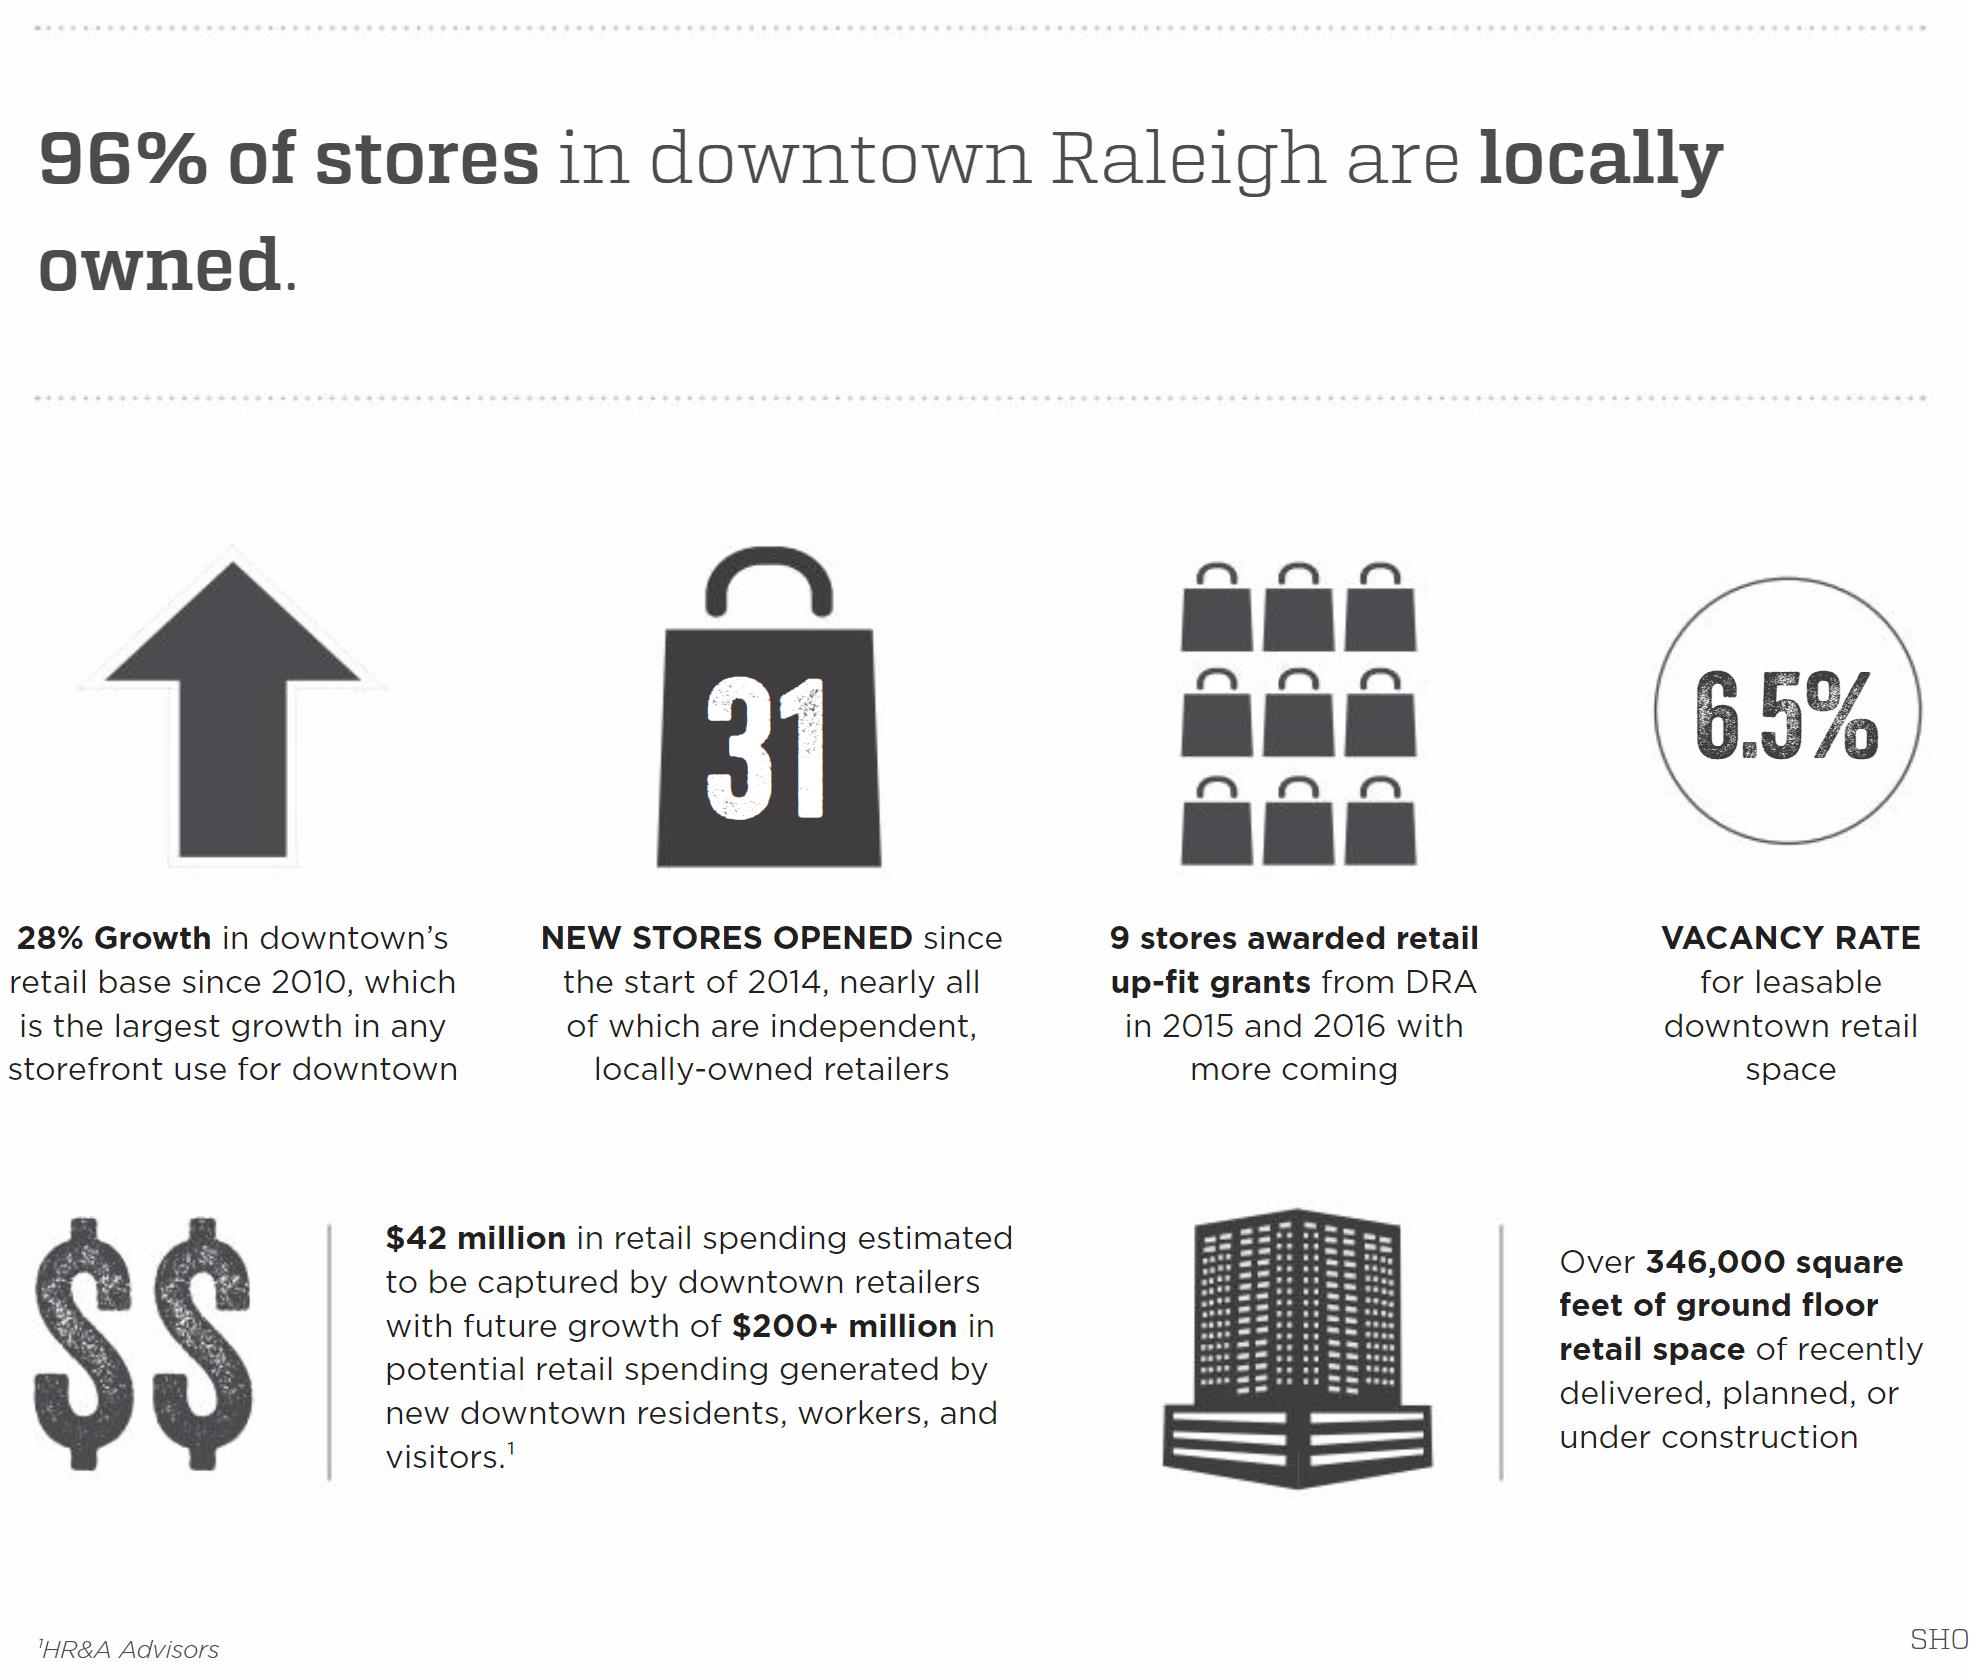
At 96% local, you won’t see me complaining about a national retailer setting up to create an “anchor” for more increased traffic. I feel we have plenty of room for something bigger to come in and really inject more retail spending in downtown.
There isn’t anything too exciting with these figures but that could change once we hit that magic threshold that enables the big box stores to seriously consider downtown Raleigh.

Taking a look at more stats from the 2017 State of Downtown Raleigh report, there are a few that cover the residential trends in the area. The graphic above offers some highlights including:
My take on it is that downtown residential is still in high demand and supply is trying to meet it. There are more units on the way which will help meet that demand and bring more residents to the core. The report states that rents are down 3% compared to 2016 so maybe supply is keeping up to a degree.
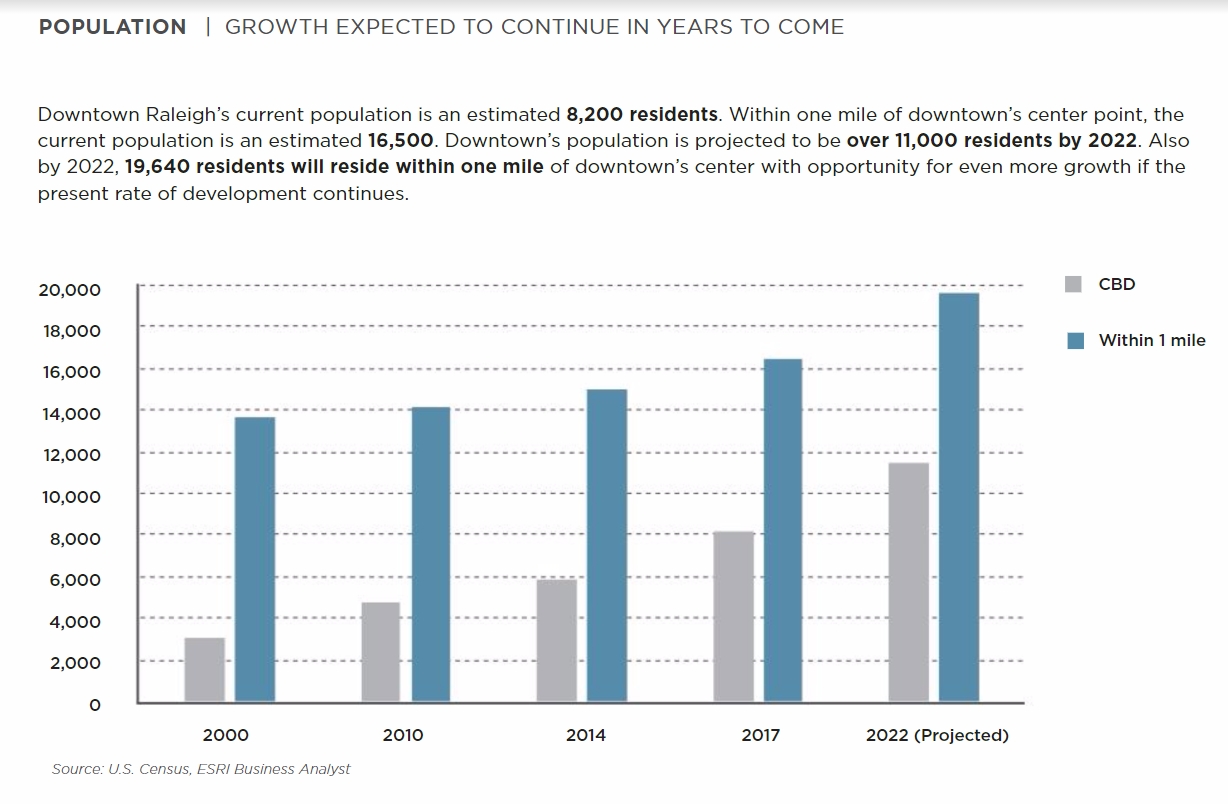
Predictions on when we cross 10,000 residents?
The chart above projects 11,000 residents by 2022. By then, we’ll have the Capital Boulevard bridge work completed and parts of Smokey Hollow finished. If those projects are very successful, more may follow in that area adding to the resident count around 2022.
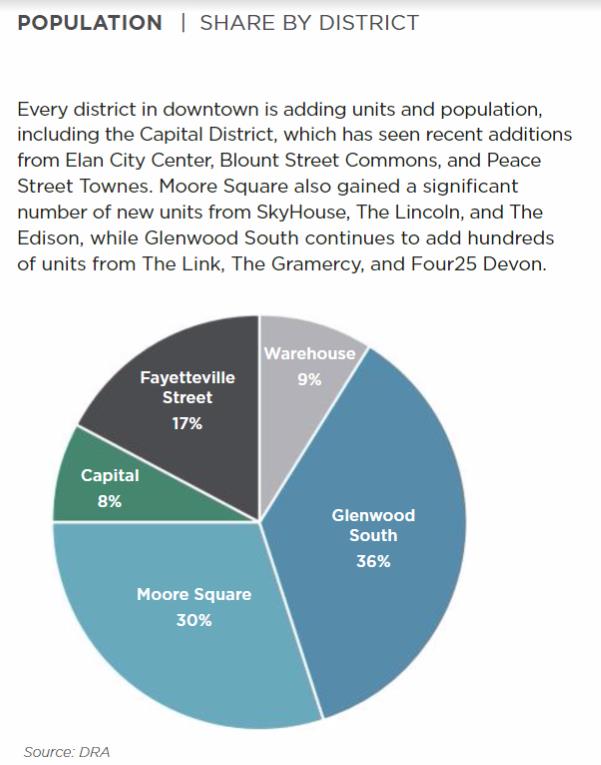
The population breakdown by district shows much the same as past years. Glenwood South is the leading home for downtown residents. Recently, Moore Square has had a big infusion of residents with Skyhouse, The Edison, and The Lincoln openings.
I imagine that will continue to be the case between these two areas as the others have less land available for residential. The warehouse district will see an uptick with The Dillon so perhaps this area could have a surge soon.
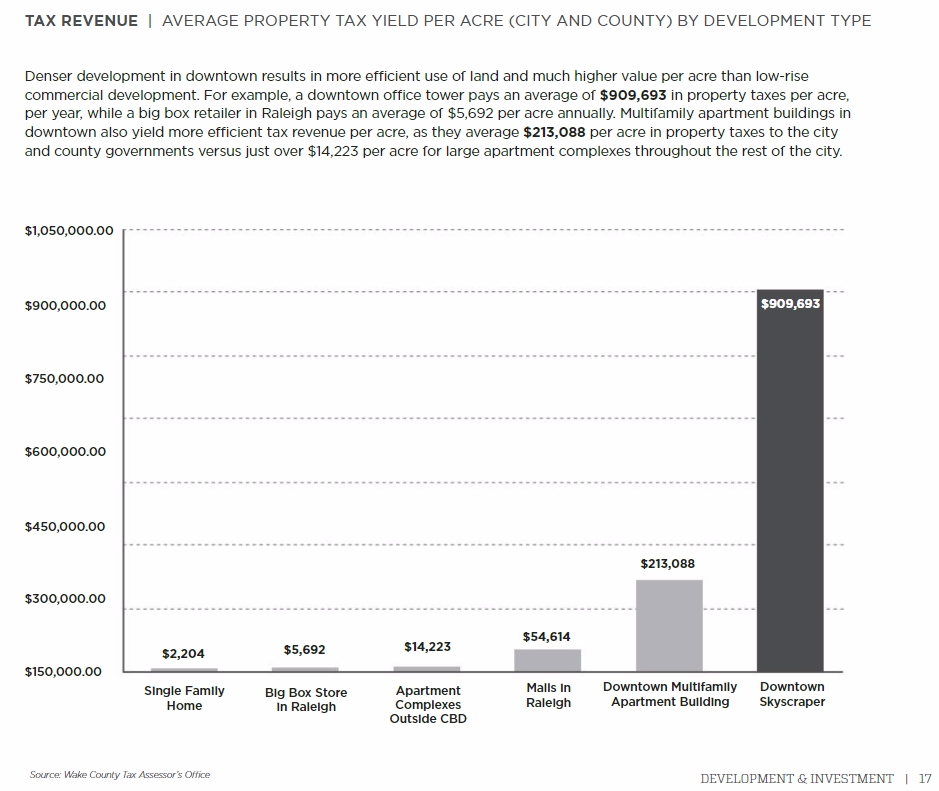
8,200 residents is still very small compared to the city’s 440,000. We’re talking about 2% of the population. However, in addition to residential projects, the commercial, convention, government, and everything else taking place makes a big impact on the health of our city from a tax point of view.
The revenue generated from downtown projects generate a lot more than those taking place in the suburbs. A dense development needs less stuff from the city; less pipes, less connections, less roads. We therefore get a lot back from it so I like showing this graphic below that a healthy downtown means that the whole city benefits.
This one I look for every year. I’m interested to see how the makeup of downtown office workers are changing, if at all.
For decades (centuries?), downtown Raleigh has been a government town. In the 2015 report, government workers made up more than half of the downtown workforce. In the 2016 report, the needle moved below 50%.
However, the recent report uses 2014 numbers to show a share of 42%. The graphics are shown above.
The change seems to be a bit dramatic year-to-year but the difference in sources may play a factor. Growth in STEM seems to be the hot selling point these days and the report plays right into Raleigh’s growth in those areas.

Released in April, I’ve finally gotten around to diving into the 2017 State of Downtown Raleigh report for the latest figures and fancy graphs of downtown activity. I’ll spread these out over the next few weeks and share what I think are some of the more interesting and thought-provoking stats.
I’ll start things off with the development list. This includes all under construction, recently completed, and planned developments. Development fans should keep this one close by for reference.
Of course, you can jump into the whole report here.

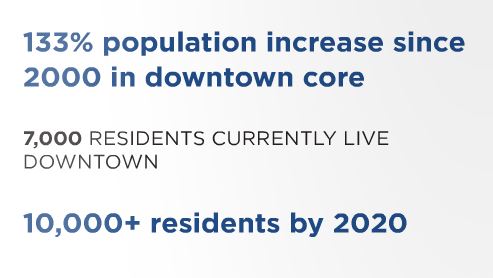
Here is some more data from the 2016 State of Downtown Raleigh report. This time, about downtown’s population numbers. We’re at an estimated 7,000 residents in the downtown area and projected to cross 10,000 in less than four years.
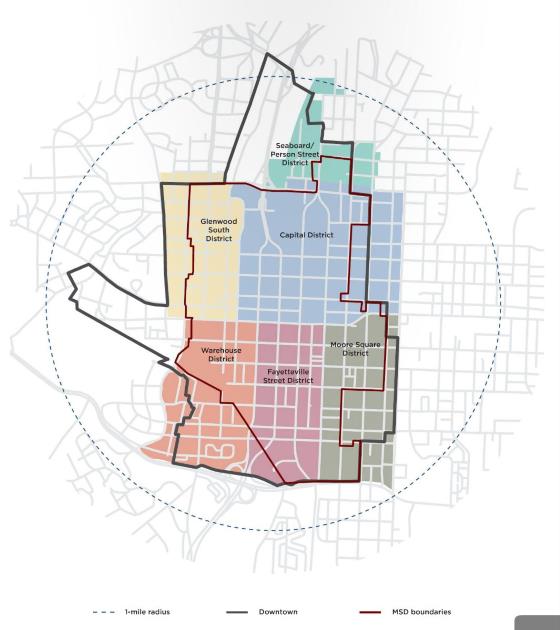
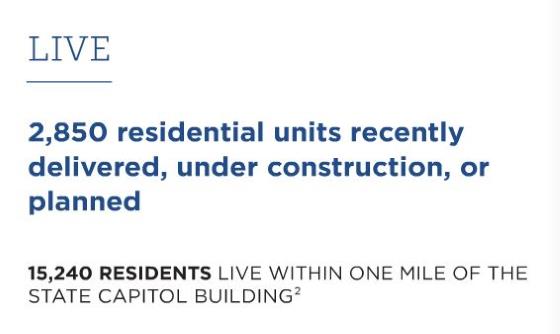
That’s between 1% and 2% of the overall city population, 3% and 4% if you bump out the boundaries to a mile-radius around the state capitol.
Glenwood South continues to be the most populated area, adding more units than any other district. However, Moore Square comes in at a close second.

I imagine next year, the warehouse district will make a big jump with the apartments at The Dillon. Glenwood South will add units from the Greyhound Apartments and Fayetteville Street will gain numbers from the Charter Square North tower.
They also included a map to show the catchment area of this data.